1 kubernetes弹性伸缩类型
在 Kubernetes 的生态中,在多个维度、多个层次提供了不同的组件来满足不同的伸缩场景。 有三种弹性伸缩: CA(Cluster Autoscaler):Node级别自动扩/缩容 cluster-autoscaler组件 HPA(Horizontal Pod Autoscaler):Pod个数自动扩/缩容 VPA(Vertical Pod Autoscaler):Pod配置自动扩/缩容,主要是CPU、内存 addon-resizer组件 如果在云上建议 HPA 结合 cluster-autoscaler 的方式进行集群的弹性伸缩管理。
2 node级别扩容/缩容
扩容:Cluster AutoScaler定期检测是否有充足的资源来调度新创建的Pod,当资源不足时会调用 Cloud Provider创建新的Node。
缩容:Cluster AutoScaler 也会定期监测Node的资源使用情况,当一个Node长时间资源利用率都很低时(低于50%)自动将其所在虚拟机从云服务商中删除。此时,原来的Pod会自动调度到其他Node上面。
支持的云提供商:
    阿里云:https://github.com/kubernetes/autoscaler/blob/master/cluster-autoscaler/cloudprovider/alicloud/README.md
    AWS: https://github.com/kubernetes/autoscaler/blob/master/cluster-autoscaler/cloudprovider/aws/README.md
    Azure: https://github.com/kubernetes/autoscaler/blob/master/cluster-autoscaler/cloudprovider/azure/README.md
ansiable扩容node流程

1. 触发新增Node
2. 调用Ansible脚本部署组件
3. 检查服务是否可用
4. 调用API将新Node加入集群或者启用Node自动加入
5. 观察新Node状态
6. 完成Node扩容,接收新Pod

node缩容流程:
#获取节点列表
kubectl get node

#设置不可调度
kubectl cordon node_name

#驱逐节点上的pod
kubectl drainnode_name --ignore-daemonsets

#移除节点
kubectl delete node $node_name
3 POD自动扩容缩容HPA
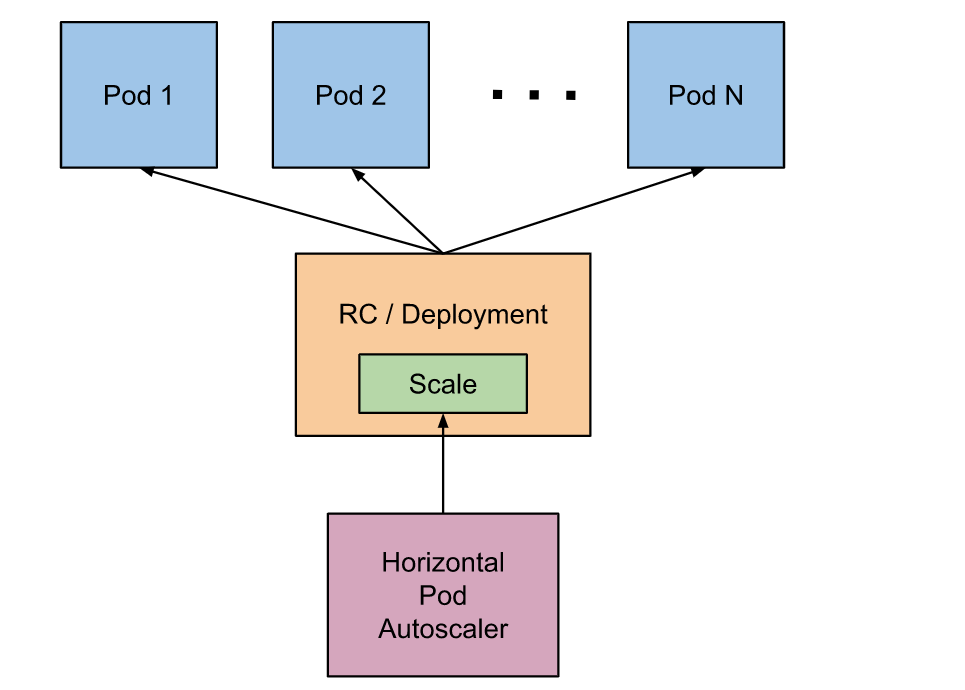
Horizontal Pod Autoscaler(HPA,Pod水平自动伸缩),根据资源利用率或者自定义指标自动调整replication controller, deployment 或 replica set,实现部署的自动扩展和缩减,让部署的规模接近于实际服务的负载。HPA不适于无法缩放的对象,例如DaemonSet。
3.1 HPA的原理
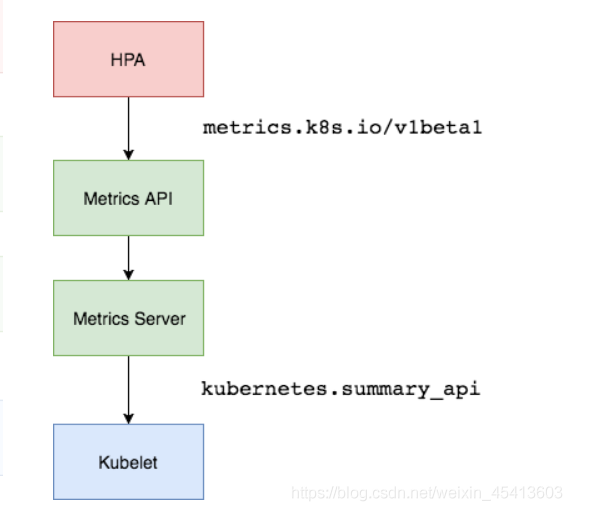
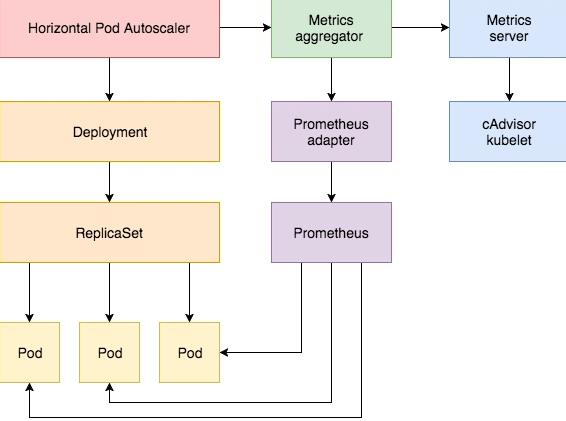
Kubernetes中的 Metrics Server持续采集所有Pod副本的指标数据。HPA控制器通过Metrics Server的API(Heapster的API或聚合API)获取这些数据,基于用户定义的扩缩容规则进行计算,得到目标Pod副本数量。当目标Pod副本数量与当前副本数量不同时,HPA控制器就向Pod的副本控制器(Deployment、RC 或 ReplicaSet)发起scale操作,调整Pod的副本数量,完成扩缩容操作。如图所示
在弹性伸缩中,冷却周期是不能逃避的一个话题, 由于评估的度量标准是动态特性,副本的数量可能会不断波动。有时被称为颠簸, 所以在每次做出扩容缩容后,冷却时间是多少。
在 HPA 中,默认的扩容冷却周期是 3 分钟,缩容冷却周期是 5 分钟。
可以通过调整kube-controller-manager组件启动参数设置冷却时间:
--horizontal-pod-autoscaler-downscale-delay :扩容冷却
--horizontal-pod-autoscaler-upscale-delay :缩容冷却
HPA的演进历程:
目前 HPA 已经支持了 autoscaling/v1、autoscaling/v2beta1和autoscaling/v2beta2 三个大版本
目前大多数人比较熟悉是autoscaling/v1,这个版本只支持CPU一个指标的弹性伸缩。
而autoscaling/v2beta1增加了支持自定义指标,autoscaling/v2beta2又额外增加了外部指标支持。
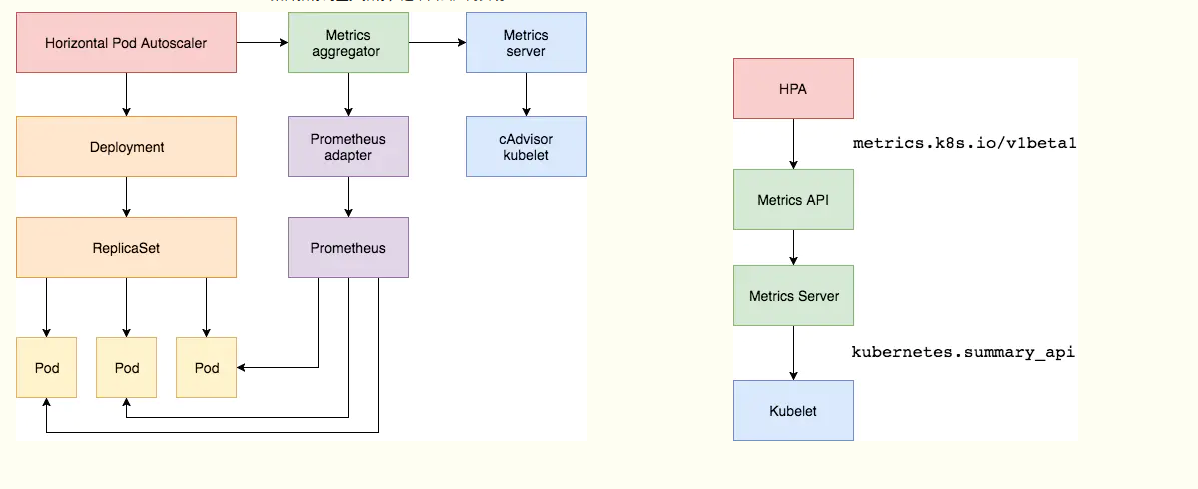
而产生这些变化不得不提的是Kubernetes社区对监控与监控指标的认识与转变。从早期Heapster到Metrics Server再到将指标边界进行划分,一直在丰富监控生态。
3.2 基于metrics server的hpa
metrics-server是一个集群范围内的资源数据集和工具,同样的,metrics-server也只是显示数据,并不提供数据存储服务,主要关注的是资源度量API的实现,比如CPU、文件描述符、内存、请求延时等指标,metric-server收集数据给k8s集群内使用,如kubectl,hpa,scheduler等.
3.2.1 Kubernetes API Aggregation
在Kubernetes1.7版本引入了聚合层,允许第三方应用程序通过将自己注册到kube-apiserver上,仍然通过API Server的HTTP URL对新的API进行访问和操作。为了实现这个机制,Kubernetes在 kube-apiserver服务中引入了一个API聚合层(API Aggregation Layer),用于将扩展API的访问请求转发到用户服务的功能。 如果你使用kubeadm部署的,默认已开启。如果你使用二进制方式部署的话,需要在kube-APIServer中添加启动参数,增加以下配置:
# vi /opt/kubernetes/cfg/kube-apiserver.conf
--requestheader-client-ca-file=/opt/kubernetes/ssl/ca.pem \
--proxy-client-cert-file=/opt/kubernetes/ssl/server.pem \
--proxy-client-key-file=/opt/kubernetes/ssl/server-key.pem \
--requestheader-allowed-names=kubernetes \
--requestheader-extra-headers-prefix=X-Remote-Extra- \
--requestheader-group-headers=X-Remote-Group \
--requestheader-username-headers=X-Remote-User \
--enable-aggregator-routing=true \

在设置完成重启kube-apiserver服务,就启用API聚合功能了。
3.2.2 部署Metrics Server
Metrics Server是一个集群范围的资源使用情况的数据聚合器。作为一个应用部署在集群中。 Metric server从每个节点上Kubelet公开的摘要API收集指标。 Metrics server通过Kubernetes聚合器注册在Master APIServer中。
部署清单地址:https://github.com/kubernetes-sigs/metrics-server
修改deployment.yaml文件,修正集群问题
问题1:metrics-server默认使用节点hostname通过kubelet 10250端口获取数据,但是coredns里面没有该数据无法解析(10.96.0.10:53),可以在metrics server启动命令添加参数 --kubelet-preferred-address-types=InternalIP 直接使用节点IP地址获取数据
问题2:kubelet 的10250端口使用的是https协议,连接需要验证tls证书。可以在metrics server启动命令添加参数--kubelet-insecure-tls不验证客户端证书
问题3:yaml文件中的image地址k8s.gcr.io/metrics-server/metrics-server:v0.4.1需要梯子,需要改成中国可以访问的image地址,可以使用aliyun的。这里使用hub.docker.com里的google镜像地址 image: phperall/metrics-server:v0.4.1

    - args:
        - /metrics-server
        - --cert-dir=/tmp
        - --secure-port=4443
        - --kubelet-preferred-address-types=InternalIP,ExternalIP,Hostname
        - --kubelet-use-node-status-port
        - --kubelet-insecure-tls
        image: phperall/metrics-server:v0.4.1

下载
wget -O metrics-server-v0.4.1.yaml https://github.com/kubernetes-sigs/metrics-server/releases/download/v0.4.1/components.yaml
部署
[root@k8s-master01 metrics-server]# kubectl apply -f metrics-server-v0.4.1.yaml
serviceaccount/metrics-server created
clusterrole.rbac.authorization.k8s.io/system:aggregated-metrics-reader created
clusterrole.rbac.authorization.k8s.io/system:metrics-server created
rolebinding.rbac.authorization.k8s.io/metrics-server-auth-reader created
clusterrolebinding.rbac.authorization.k8s.io/metrics-server:system:auth-delegator created
clusterrolebinding.rbac.authorization.k8s.io/system:metrics-server created
service/metrics-server created
deployment.apps/metrics-server created
apiservice.apiregistration.k8s.io/v1beta1.metrics.k8s.io created

查看是否安装成功
[root@k8s-master01 metrics-server]# kubectl get pods  -n kube-system  -o wide |grep metrics-server
metrics-server-5bd7f89fd5-6jprv        1/1     Running    0          143m   10.244.4.232    k8s-node04     <none>           <none>

[root@k8s-master01 metrics-server]# kubectl top pod
NAME                                      CPU(cores)   MEMORY(bytes)
jenkins-0                                 4m           463Mi
nfs-client-provisioner-794b747b95-hj9sk   4m           13Mi
nginx-f89759699-mqvvm                     0m           3Mi
nginx-statefulset-0                       0m           2Mi
nginx-statefulset-1                       0m           2Mi
nginx-statefulset-2                       0m           2Mi
nginx-statefulset-pod-0                   0m           2Mi
nginx-statefulset-pod-1                   0m           2Mi
nginx-statefulset-pod-2                   0m           2Mi
svc1-5ff98455f6-22pnp                     0m           2Mi
svc2-678c5fb65-nx4c6                      0m           1Mi
svc3-55569d594-z9mk8                      0m           0Mi
web-65b7447c7-f5mht                       0m           3Mi
[root@k8s-master01 metrics-server]# kubectl top node
NAME           CPU(cores)   CPU%   MEMORY(bytes)   MEMORY%
k8s-master01   256m         12%    1656Mi          45%
k8s-node01     103m         10%    1601Mi          43%
k8s-node02     156m         7%     2297Mi          62%
k8s-node03     66m          6%     1305Mi          47%
k8s-node04     384m         38%    536Mi           19%

[root@k8s-master01 metrics-server]# kubectl get apiservice |grep metrics
v1beta1.metrics.k8s.io                 kube-system/metrics-server   True        6h23m

kubectl describe apiservice v1beta1.metrics.k8s.io
3.3 autoscaling/v1(CPU指标实践)
[root@k8s-master01 metrics-server]# cat nginx-deployment.yaml
apiVersion: apps/v1
kind: Deployment
metadata:
  name: nginx-hpa
spec:
  replicas: 1
  selector:
     matchLabels:
       app: nginx
  template:
    metadata:
      labels:
        app: nginx
    spec:
      containers:
      - name: nginx
        image: docker.io/nginx
        ports:
        - containerPort: 80
        resources:
          limits:
             cpu: 200m
          requests:
             cpu: 200m
创建的pod一定要加资源限制,否则hpa会报错如下
TARGETS         <unknown>/10%

[root@k8s-master01 metrics-server]# kubectl get pods |grep nginx-hpa
nginx-hpa-5776f5b79f-gwcbq                1/1     Running   0          92s

开启自动伸缩,cpu使用超过10%
[root@k8s-master01 metrics-server]# kubectl autoscale  deployment nginx-hpa --cpu-percent=10 --min=1 --max=5
horizontalpodautoscaler.autoscaling/nginx-hpa autoscaled

或者
[root@k8s-master01 metrics-server]#  kubectl autoscale deployment nginx-hpa --cpu-percent=10 --min=1 --max=5 --dry-run=client -o yaml > hpa-v1-nginx.yaml
[root@k8s-master01 metrics-server]# cat hpa-v1-nginx.yaml
apiVersion: autoscaling/v1
kind: HorizontalPodAutoscaler
metadata:
  name: nginx-hpa
spec:
  maxReplicas: 5
  minReplicas: 1
  scaleTargetRef:
    apiVersion: apps/v1
    kind: Deployment
    name: nginx-hpa
  targetCPUUtilizationPercentage: 10

验证基于cpu的pod自动伸缩
[root@k8s-master01 metrics-server]#  kubectl get hpa
NAME        REFERENCE              TARGETS   MINPODS   MAXPODS   REPLICAS   AGE
nginx-hpa   Deployment/nginx-hpa   0%/10%    1         5         1          48m

现在可以看到HPA资源对象已经正常了,现在我们来增大负载进行测试,我们来创建一个 busybox 的Pod,并且循环访问上面创建的Pod:
kubectl run -it --image busybox test-hpa --restart=Never --rm /bin/sh
 / # while true; do wget -q -O- http://10.244.4.237; done
[root@k8s-master01 ~]# kubectl get hpa
NAME        REFERENCE              TARGETS    MINPODS   MAXPODS   REPLICAS   AGE
nginx-hpa   Deployment/nginx-hpa   188%/10%   1         5         4          56m
[root@k8s-master01 ~]# kubectl get pods -l app=nginx-hpa
NAME                         READY   STATUS              RESTARTS   AGE
nginx-hpa-647f846844-hgmvf   0/1     ContainerCreating   0          32s
nginx-hpa-647f846844-hzstt   0/1     ContainerCreating   0          47s
nginx-hpa-647f846844-n8zh6   1/1     Running             0          12m
nginx-hpa-647f846844-rlj66   1/1     Running             0          47s
nginx-hpa-647f846844-x9676   1/1     Running             0          47s

查看 HPA 资源的对象了解工作过程:
[root@k8s-master01 metrics-server]# kubectl describe hpa nginx-hpa
Name:                                                  nginx-hpa
Namespace:                                             default
Labels:                                                <none>
Annotations:                                           <none>
CreationTimestamp:                                     Tue, 07 Sep 2021 14:39:51 +0800
Reference:                                             Deployment/nginx-hpa
Metrics:                                               ( current / target )
  resource cpu on pods  (as a percentage of request):  0% (0) / 10%
Min replicas:                                          1
Max replicas:                                          5
Deployment pods:                                       5 current / 5 desired
Conditions:
  Type            Status  Reason               Message
  ----            ------  ------               -------
  AbleToScale     True    ScaleDownStabilized  recent recommendations were higher than current one, applying the highest recent recommendation
  ScalingActive   True    ValidMetricFound     the HPA was able to successfully calculate a replica count from cpu resource utilization (percentage of request)
  ScalingLimited  True    TooManyReplicas      the desired replica count is more than the maximum replica count
Events:
  Type     Reason                        Age                  From                       Message
  ----     ------                        ----                 ----                       -------
  Warning  FailedComputeMetricsReplicas  56m (x12 over 59m)   horizontal-pod-autoscaler  invalid metrics (1 invalid out of 1), first error is: failed to get cpu utilization: missing request for cpu
  Warning  FailedGetResourceMetric       19m (x159 over 59m)  horizontal-pod-autoscaler  missing request for cpu
  Warning  FailedGetResourceMetric       14m (x2 over 14m)    horizontal-pod-autoscaler  did not receive metrics for any ready pods
  Normal   SuccessfulRescale             3m39s                horizontal-pod-autoscaler  New size: 4; reason: cpu resource utilization (percentage of request) above target
  Normal   SuccessfulRescale             3m24s                horizontal-pod-autoscaler  New size: 5; reason: cpu resource utilization (percentage of request) above target

工作流程:hpa -> apiserver -> kube aggregation -> metrics-server -> kubelet(cadvisor)
3.4 autoscaling/v2beta2(多指标)
为满足更多的需求, HPA 还有 autoscaling/v2beta1和 autoscaling/v2beta2两个版本。 这两个版本的区别是 autoscaling/v1beta1支持了 Resource Metrics(CPU)和 Custom Metrics(应用程序指标),而在 autoscaling/v2beta2的版本中额外增加了 External Metrics的支持。 metrics中的type字段有四种类型的值:Object、Pods、Resource、External。 Resource:指的是当前伸缩对象下的pod的cpu和memory指标,只支持Utilization和AverageValue类型的目标值。 Object:指的是指定k8s内部对象的指标,数据需要第三方adapter提供,只支持Value和AverageValue类型的目标值。 Pods:指的是伸缩对象Pods的指标,数据需要第三方的adapter提供,只允许AverageValue类型的目标值。 External:指的是k8s外部的指标,数据同样需要第三方的adapter提供,只支持Value和AverageValue类型的目标值。
apiVersion: autoscaling/v2beta2
kind: HorizontalPodAutoscaler
metadata:
  name: php-apache
  namespace: default
spec:
  # HPA的伸缩对象描述,HPA会动态修改该对象的pod数量
  scaleTargetRef:
    apiVersion: apps/v1
    kind: Deployment
    name: php-apache
  # HPA的最小pod数量和最大pod数量
  minReplicas: 1
  maxReplicas: 10
  # 监控的指标数组,支持多种类型的指标共存
  metrics:
  # Object类型的指标
  - type: Object
    object:
      metric:
        # 指标名称
        name: requests-per-second
      # 监控指标的对象描述,指标数据来源于该对象
      describedObject:
        apiVersion: networking.k8s.io/v1beta1
        kind: Ingress
        name: main-route
      # Value类型的目标值,Object类型的指标只支持Value和AverageValue类型的目标值
      target:
        type: Value
        value: 10k
  # Resource类型的指标
  - type: Resource
    resource:
      name: cpu
      # Utilization类型的目标值,Resource类型的指标只支持Utilization和AverageValue类型的目标值
      target:
        type: Utilization
        averageUtilization: 50
  # Pods类型的指标
  - type: Pods
    pods:
      metric:
        name: packets-per-second
      # AverageValue类型的目标值,Pods指标类型下只支持AverageValue类型的目标值
      target:
        type: AverageValue
        averageValue: 1k
  # External类型的指标
  - type: External
    external:
      metric:
        name: queue_messages_ready
        # 该字段与第三方的指标标签相关联,(此处官方文档有问题,正确的写法如下)
        selector:
          matchLabels:
            env: "stage"
            app: "myapp"
      # External指标类型下只支持Value和AverageValue类型的目标值
      target:
        type: AverageValue
        averageValue: 30

参数解释:
spec中嵌套的个字段的说明如下:

(1)maxReplicas:自动伸缩可扩展至Pod副本数的上限
(2)minReplicas:自动伸缩pod副本数下限
(3)scaleTargetRef:要伸缩的目标资源
(4)metrics:用于计算所需的Pod副本数量的指标列表
(5)external:用于应用非附属于任何对象的全局指标
(6)object:应用描述集群中某单一对象的特定指标
(7)pods:应用被弹性伸缩的pod对象的特定指标
(8)resource:应用资源指标,即当前被弹性伸缩的pod对象中容器的requests和limits中定义的指标。
(9)type:标识指标源的类型

例子:

如果你的监控系统能够提供网络流量数据,你可以通过kubectl edit命令将上述Horizontal Pod Autoscaler的定义更改为:
apiVersion: autoscaling/v2beta1
kind: HorizontalPodAutoscaler
metadata:
  name: php-apache
  namespace:default
spec:
  scaleTargetRef:
    apiVersion: apps/v1
    kind: Deployment
    name: php-apache
  minReplicas: 1
  maxReplicas: 10
  metrics:
  - type: Resource
    resource:
      name: cpu
      target:
        type: AverageUtilization
        averageUtilization: 50
  - type: Pods
    pods:
      metric:
        name: packets-per-second
      targetAverageValue: 1k
  - type: Object
    object:
      metric:
        name: requests-per-second
      describedObject:
        apiVersion: networking.k8s.io/v1beta1
        kind: Ingress
        name: main-route
      target:
        kind: Value
        value: 10k
status:
  observedGeneration: 1
  lastScaleTime: <some-time>
  currentReplicas: 1
  desiredReplicas: 1
  currentMetrics:
  - type: Resource
    resource:
      name: cpu
    current:
      averageUtilization: 0
      averageValue: 0
  - type: Object
    object:
      metric:
        name: requests-per-second
      describedObject:
        apiVersion: networking.k8s.io/v1beta1
        kind: Ingress
        name: main-route
      current:
        value: 10k
然后,你的HorizontalPodAutoscaler将会尝试确保每个Pod的CPU利用率在50%以内,每秒能够服务1000个数据包请求,并确保所有在Ingress后的Pod每秒能够服务的请求总数达到10000个。
3.4.1 基于cpu和内存指标的缩放
cat hpa-v2-nginx.yaml
apiVersion: autoscaling/v2beta1
kind: HorizontalPodAutoscaler
metadata:
  name: nginx-hpa-men
spec:
  scaleTargetRef:
    apiVersion: apps/v1
    kind: Deployment
    name: nginx-hpa
  minReplicas: 1
  maxReplicas: 5
  metrics:
  - type: Resource
    resource:
      name: memory
      targetAverageUtilization: 60
  - type: Resource
    resource:
      name: cpu
      targetAverageUtilization: 60

[root@k8s-master01 metrics-server]# kubectl get hpa |grep nginx-hpa-men
nginx-hpa-men   Deployment/nginx-hpa   3%/60%, 0%/60%   1         5         1          132m

验证
[root@k8s-master01 metrics-server]#  kubectl exec -it nginx-hpa-647f846844-n8zh6 /bin/bash
 mkdir /tmp/memory
 root@nginx-hpa-647f846844-n8zh6:/# dd if=/dev/zero of=/tmp/memory/block

[root@k8s-master01 ~]# kubectl get hpa
NAME            REFERENCE              TARGETS               MINPODS   MAXPODS   REPLICAS   AGE
nginx-hpa       Deployment/nginx-hpa   1126%/10%             1         5         5          26h
nginx-hpa-men   Deployment/nginx-hpa   347%/60%, 1126%/60%   1         5         4          135m
[root@k8s-master01 ~]# kubectl get pod |grep nginx-hpa
nginx-hpa-647f846844-bk6xx                0/1     ContainerCreating   0          36s
nginx-hpa-647f846844-n8zh6                1/1     Running             0          25h
nginx-hpa-647f846844-n9m8b                0/1     ContainerCreating   0          22s
nginx-hpa-647f846844-pd4jz                0/1     ContainerCreating   0          37s
nginx-hpa-647f846844-qmvp6                0/1     ContainerCreating   0          36s
3.5 基于Prometheus自定义指标缩放
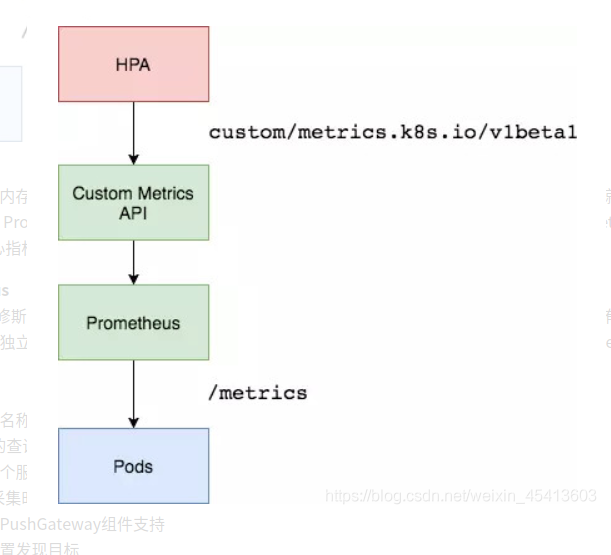
如果想根据自定义指标:如请求qps/5xx错误数来实现HPA,就需要使用自定义指标了,目前比较成熟的实现是 Prometheus Custom Metrics。自定义指标由Prometheus来提供,再利用k8s-prometheus-adpater聚合到apiserver,实现和核心指标(metric-server)同样的效果。 工作流程:hpa -> apiserver -> kube aggregation -> prometheus-adapter -> prometheus -> pods
3.5.1 部署prometheus server
https://devopstack.cn/k8s/1341.html
3.5.2 部署Custom Metrics Adapter
但是prometheus采集到的metrics并不能直接给k8s用,因为两者数据格式不兼容,还需要另外一个组件(k8s-prometheus-adpater),将prometheus的metrics 数据格式转换成k8s API接口能识别的格式,转换以后,因为是自定义API,所以还需要用Kubernetes aggregator在主APIServer中注册,以便直接通过/apis/来访问。
curl -L -o helm-v3.2.4-linux-amd64.tar.gz https://file.choerodon.com.cn/kubernetes-helm/v3.2.4/helm-v3.2^C-linux-amd64.tar.gz
tar zxvf helm-v3.2.4-linux-amd64.tar.gz
 mv linux-amd64/helm /usr/local/bin/
 [root@k8s-master01 ~]# helm version
version.BuildInfo{Version:"v3.2.4", GitCommit:"0ad800ef43d3b826f31a5ad8dfbb4fe05d143688", GitTreeState:"clean", GoVersion:"go1.13.12"}

helm repo add prometheus-community https://prometheus-community.github.io/helm-charts helm repo update
 helm search repo prometheus-community |grep prometheus-adapter
 prometheus-community/prometheus-adapter            2.17.0          v0.9.0      A Helm chart for k8s prometheus adapter

[root@k8s-master01 ~]#  helm install prometheus-adapter prometheus-community/prometheus-adapter --namespace kube-system --set prometheus.url=http://prometheus.kube-system,prometheus.port=9090

修改镜像地址为: directxman12/k8s-prometheus-adapter-amd64

查看
[root@k8s-master01 prometheus-k8s]#  kubectl get pods -n kube-system |grep prometheus-adapter
prometheus-adapter-5b8b9dff57-z84pn    1/1     Running   0          17m
[root@k8s-master01 prometheus-k8s]# helm list -n kube-system
NAME                NAMESPACE   REVISION    UPDATED                                 STATUS      CHART                       APP VERSION
prometheus-adapter  kube-system 1           2021-09-15 10:47:52.711601038 +0800 CST deployed    prometheus-adapter-2.17.0   v0.9.0

确保适配器注册到APIServer

[root@k8s-master01 prometheus-k8s]#  kubectl get apiservices |grep custom
v1beta1.custom.metrics.k8s.io          kube-system/prometheus-adapter   True        14d
# kubectl get --raw "/apis/custom.metrics.k8s.io/v1beta1"
3.5.3 基于QPS指标实践
3.5.3.1 部署自定义暴露指标接口的服务
部署一个自开发的暴露Prometheus指标接口的服务
cat deployment.yaml
apiVersion: apps/v1
kind: Deployment
metadata:
labels:
app: metrics-app
name: metrics-app
spec:
replicas: 3
selector:
matchLabels:
app: metrics-app
template:
metadata:
labels:
app: metrics-app
annotations:
prometheus.io/scrape: "true"
prometheus.io/port: "80"
prometheus.io/path: "/metrics"
spec:
containers:
- image: lizhenliang/metrics-app
name: metrics-app
ports:
- name: web
containerPort: 80
resources:
requests:
cpu: 200m
memory: 256Mi
readinessProbe:
httpGet:
path: /
port: 80
initialDelaySeconds: 3
periodSeconds: 5
livenessProbe:
httpGet:
path: /
port: 80
initialDelaySeconds: 3
periodSeconds: 5
---
apiVersion: v1
kind: Service
metadata:
name: metrics-app
labels:
app: metrics-app
spec:
ports:
- name: web
port: 80
targetPort: 80
selector:
app: metrics-app
kubectl get pods |grep metrics-app
metrics-app-b4d7dd845-q5zx7 1/1 Running 0 3m44s
metrics-app-b4d7dd845-rsqxc 1/1 Running 0 3m44s
metrics-app-b4d7dd845-zrr2k 1/1 Running 0 3m45s
[root@k8s-master01 hpa-qps]# kubectl get svc |grep metrics-app
metrics-app ClusterIP 10.107.66.122 <none> 80/TCP 4m18s
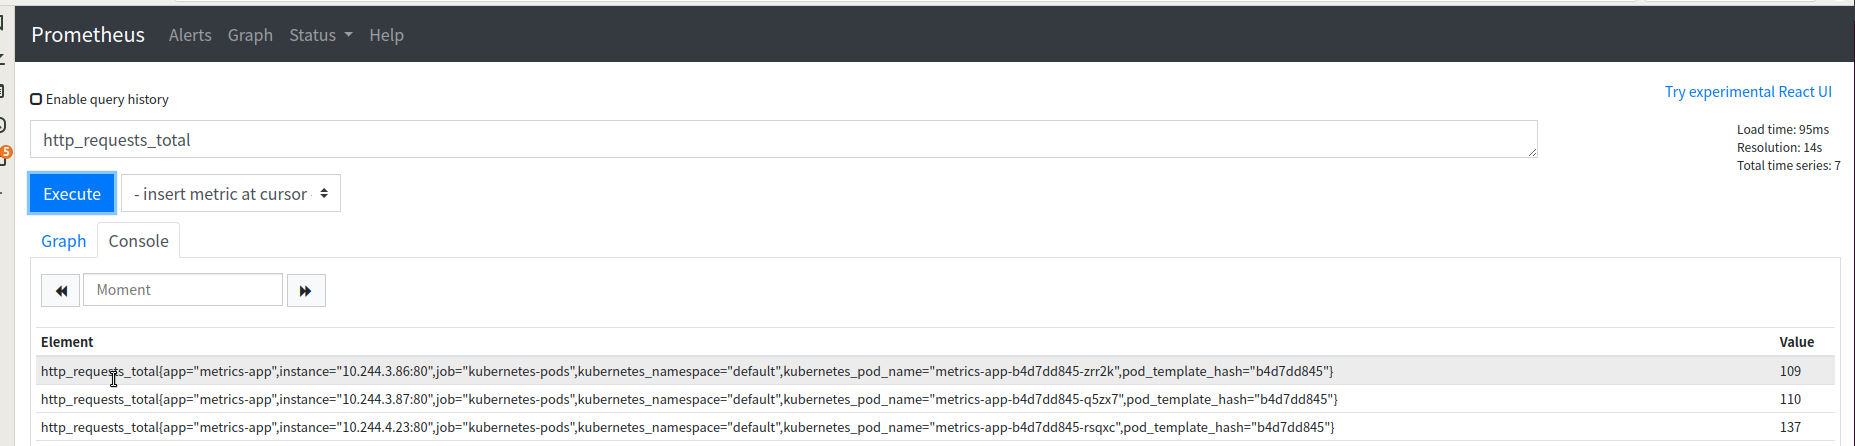
[root@k8s-master01 hpa-qps]# curl 10.107.66.122/metrics #访问metrics即可获取值
# HELP http_requests_total The amount of requests in total
# TYPE http_requests_total counter
http_requests_total 69
# HELP http_requests_per_second The amount of requests per second the latest ten seconds
# TYPE http_requests_per_second gauge
http_requests_per_second 0.6
3.5.3.2 创建基于qps的HPA
 cat qps-hpa-v2.yml
apiVersion: autoscaling/v2beta2
kind: HorizontalPodAutoscaler
metadata:
  name: metrics-app-hpa
  namespace: default
spec:
  scaleTargetRef:
    apiVersion: apps/v1
    kind: Deployment
    name: metrics-app
  minReplicas: 1
  maxReplicas: 10
  metrics:
  - type: Pods
    pods:
      metric:
        name: http_requests_per_second
      target:
        type: AverageValue
        averageValue: 800m

[root@k8s-master01 hpa-qps]# kubectl apply -f qps-hpa-v2.yml
horizontalpodautoscaler.autoscaling/metrics-app-hpa created
3.5.3.3 测试基于QPS的自动伸缩
使用Prometheus提供的指标测试来测试自定义指标(QPS)的自动缩放
- 我的微信
- 这是我的微信扫一扫
-

- 我的微信公众号
- 我的微信公众号扫一扫
-