1.角色规划
| ip | 系统 | 规划 |
|---|---|---|
| 192.168.123.39 | Ubuntu 16.04.5 | Elasticsearch,Kibana |
| 192.168.123.40 | Ubuntu 16.04.5 | Logstash |
| 192.168.123.41 | Ubuntu 16.04.5 | Filebeat,nginx |
2.安装elasticsearch
• 安装jdk
sudo apt-get install openjdk-8-jre
• 导入Elasticsearch PGP key
wget -qO - https://artifacts.elastic.co/GPG-KEY-elasticsearch | sudo apt-key add -
• 设置apt源
sudo apt-get install apt-transport-https
echo "deb https://artifacts.elastic.co/packages/6.x/apt stable main" | sudo tee -a /etc/apt/sources.list.d/elastic-6.x.list
• 安装Elasticsearch
sudo apt-get update && sudo apt-get install elasticsearch
3.配置启动elasticsearch
• sudo egrep -v "^$|^#" /etc/elasticsearch/elasticsearch.yml
cluster.name: myelk
node.name: node01
node.attr.rack: r1
path.data: /var/lib/elasticsearch
path.logs: /var/log/elasticsearch
network.host: 0.0.0.0
http.port: 9200
• 启动
sudo /bin/systemctl daemon-reload
sudo /bin/systemctl enable elasticsearch.service
sudo systemctl start elasticsearch.service
sudo systemctl stop elasticsearch.service
4.安装Kibana
安装kibana
wget -qO - https://artifacts.elastic.co/GPG-KEY-elasticsearch | sudo apt-key add -
sudo apt-get install apt-transport-https
echo "deb https://artifacts.elastic.co/packages/6.x/apt stable main" | sudo tee -a /etc/apt/sources.list.d/elastic-6.x.list
sudo apt-get update && sudo apt-get install kibana
•  配置kibana
upsmart@node02:~sudo egrep -v "^|^#"  /etc/kibana/kibana.yml
server.port: 5601
server.host: "0.0.0.0"
elasticsearch.hosts: ["http://192.168.123.39:9200"]
•  启动kibana
sudo /bin/systemctl daemon-reload
sudo /bin/systemctl enable kibana.service
sudo systemctl start kibana.service
5.安装filebeat
安装elastach插件
sudo bin/elasticsearch-plugin install ingest-geoip
sudo bin/elasticsearch-plugin install ingest-user-agent
sudo service  elasticsearch restart
• 安装fielbeat
curl -L -O https://artifacts.elastic.co/downloads/beats/filebeat/filebeat-6.6.1-amd64.deb
sudo dpkg -i filebeat-6.6.1-amd64.deb
• 安装nginx
sudo apt-get install  nginx
sudo filebeat modules enable nginx
service nginx start
sudo service nginx start
6.配置filebeat
egrep -v  "#|^" /etc/filebeat/filebeat.yml
filebeat.inputs:
- type: log
  enabled: false
  paths:
    - /var/log/*.log
filebeat.config.modules:
  path:{path.config}/modules.d/*.yml
  reload.enabled: false
setup.template.settings:
  index.number_of_shards: 3
setup.kibana:
  host: "192.168.123.39:5601"
output.elasticsearch:
  hosts: ["192.168.123.39:9200"]
7.配置filebeat收集nginx日志
 • egrep -v  "#|^$" /etc/filebeat/modules.d/nginx.yml
- module: nginx
  access:
    enabled: true
    var.paths: ["/var/log/nginx/access.log*"]
  error:
    enabled: true
    var.paths: ["/var/log/nginx/error.log*"]
8.启动filebeat
 sudo filebeat setup
 sudo service filebeat start
9.配置kibana展示nginx日志分析结果
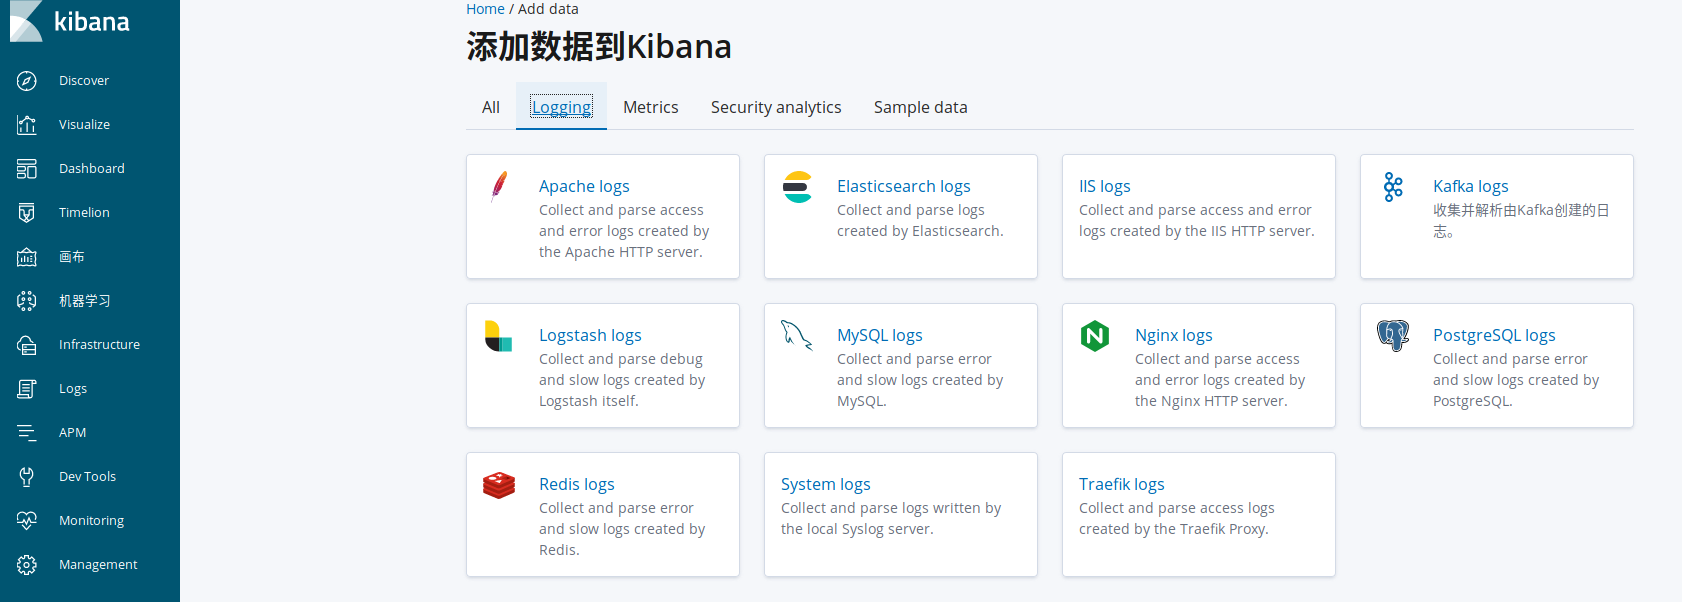
展示nginx日志最终效果图如下: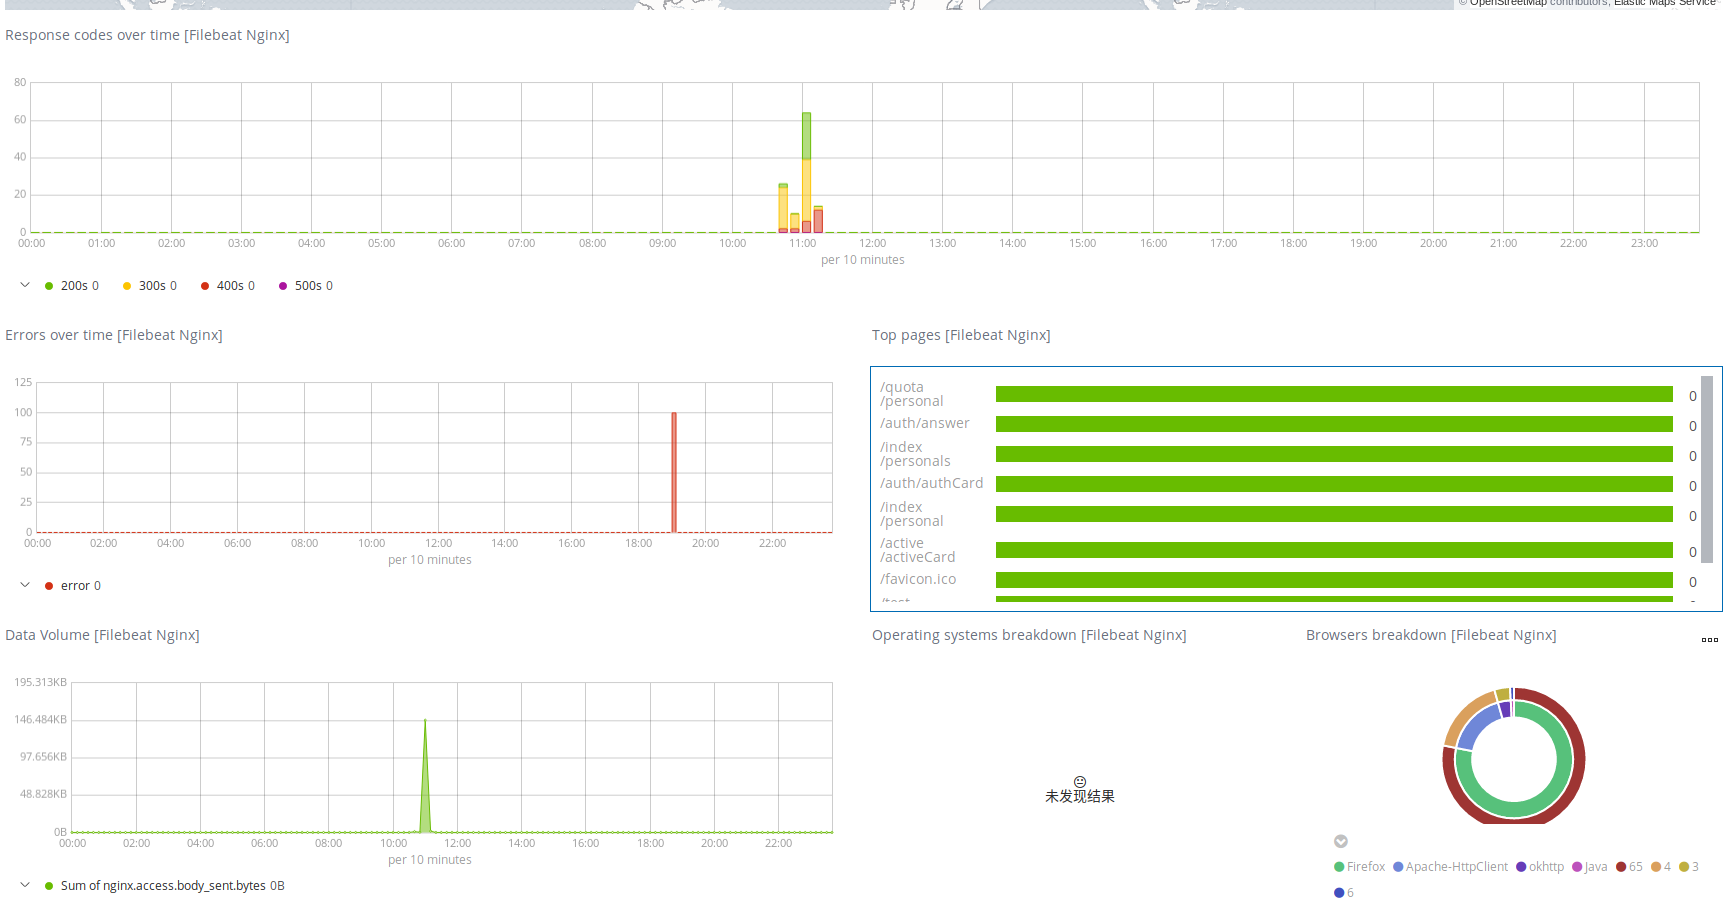
- 我的微信
- 这是我的微信扫一扫
-

- 我的微信公众号
- 我的微信公众号扫一扫
-