1 elk收集k8s日志概述
1.1 elk主要收集哪些日志
ELK收集k8s日志主要有如下部分: 1.K8S系统的组件日志 2.K8S Cluster里面部署的应用程序日志
1.2 收集日志方案
k8s日志收集方案有主要有两种,一种是node上部署日志的收集程序,比如用daemonset方式部署,对本节点容器下的目录进行采集。并且把容器内的目录挂载到宿主机目录上面。目录为对本节点/var/log/kubelet/pods和 /var/lib/docker/containers/两个目录下的日志进行采集。还有一种是Pod中附加专用日志收集的容器 每个运行应用程序的Pod中增加一个日志收集容器,使用emtyDir共享日志目录让日志收集程序读取到!
1.3 elk架构图
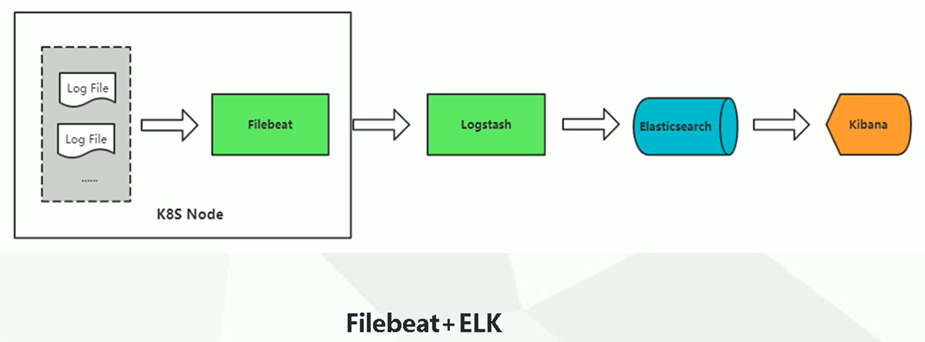
2 在K8S中部署ELK
2.1 部署elasticsearch
创建es
cat elasticsearch.yaml
apiVersion: apps/v1
kind: StatefulSet
metadata:
  name: elasticsearch
  namespace: kube-system
  labels:
    k8s-app: elasticsearch
spec:
  serviceName: elasticsearch
  selector:
    matchLabels:
      k8s-app: elasticsearch
  template:
    metadata:
      labels:
        k8s-app: elasticsearch
    spec:
      containers:
      - image: elasticsearch:7.5.0
        name: elasticsearch
        resources:
          limits:
            cpu: 1
            memory: 2Gi
          requests:
            cpu: 0.5
            memory: 500Mi
        env:
          - name: "discovery.type"
            value: "single-node"
          - name: ES_JAVA_OPTS
            value: "-Xms512m -Xmx2g"
        ports:
        - containerPort: 9200
          name: db
          protocol: TCP
        volumeMounts:
        - name: elasticsearch-data
          mountPath: /usr/share/elasticsearch/data
  volumeClaimTemplates:
  - metadata:
      name: elasticsearch-data
    spec:
      storageClassName: "managed-nfs-storage"
      accessModes: [ "ReadWriteOnce" ]
      resources:
        requests:
          storage: 15Gi
---
apiVersion: v1
kind: Service
metadata:
  name: elasticsearch
  namespace: kube-system
spec:
  clusterIP: None
  ports:
  - port: 9200
    protocol: TCP
    targetPort: db
  selector:
    k8s-app: elasticsearch

 生效清单文件
 kubectl apply -f elasticsearch.yaml
statefulset.apps/elasticsearch created
service/elasticsearch created

 kubectl get pod -n kube-system  |grep elasticsearch-0
elasticsearch-0                        1/1     Running   0          7m19s

[root@k8s-master01 elk]# kubectl get svc -n kube-system  |grep ela
elasticsearch        ClusterIP   None             <none>        9200/TCP                 14m

不建议es部署在k8s中
2.2 部署kibana
然后,需要部署一个Kibana来对搜集到的日志进行可视化展示,使用Deployment的方式编写一个yaml,使用ingress对外进行暴露访问,直接引用了es
[root@k8s-master01 elk]# cat kibana.yaml
apiVersion: apps/v1
kind: Deployment
metadata:
name: kibana
namespace: kube-system
labels:
k8s-app: kibana
spec:
replicas: 1
selector:
matchLabels:
k8s-app: kibana
template:
metadata:
labels:
k8s-app: kibana
spec:
containers:
- name: kibana
image: kibana:7.5.0
resources:
limits:
cpu: 1
memory: 500Mi
requests:
cpu: 0.5
memory: 200Mi
env:
- name: ELASTICSEARCH_HOSTS
value: http://elasticsearch-0.elasticsearch.kube-system:9200
- name: I18N_LOCALE
value: zh-CN
ports:
- containerPort: 5601
name: ui
protocol: TCP
---
apiVersion: v1
kind: Service
metadata:
name: kibana
namespace: kube-system
spec:
ports:
- port: 5601
protocol: TCP
targetPort: ui
selector:
k8s-app: kibana
---
apiVersion: extensions/v1beta1
kind: Ingress
metadata:
name: kibana
namespace: kube-system
spec:
rules:
- host: kibana.devopstack.cn
http:
paths:
- path: /
backend:
serviceName: kibana
servicePort: 5601
生效清单文件
kubectl apply -f kibana.yaml
deployment.apps/kibana created
service/kibana created
ingress.extensions/kibana created
[root@k8s-master01 elk]# kubectl get pods -n kube-system |grep kibana
kibana-97dd5fc56-mplvv 1/1 Running 0 4m58s
[root@k8s-master01 elk]# kubectl get ingress -n kube-system |grep kibana
kibana <none> kibana.devopstack.cn 80 5m4s
[root@k8s-master01 elk]# kubectl get svc -n kube-system |grep kibana
kibana ClusterIP 10.109.192.180 <none> 5601/TCP 5m40s
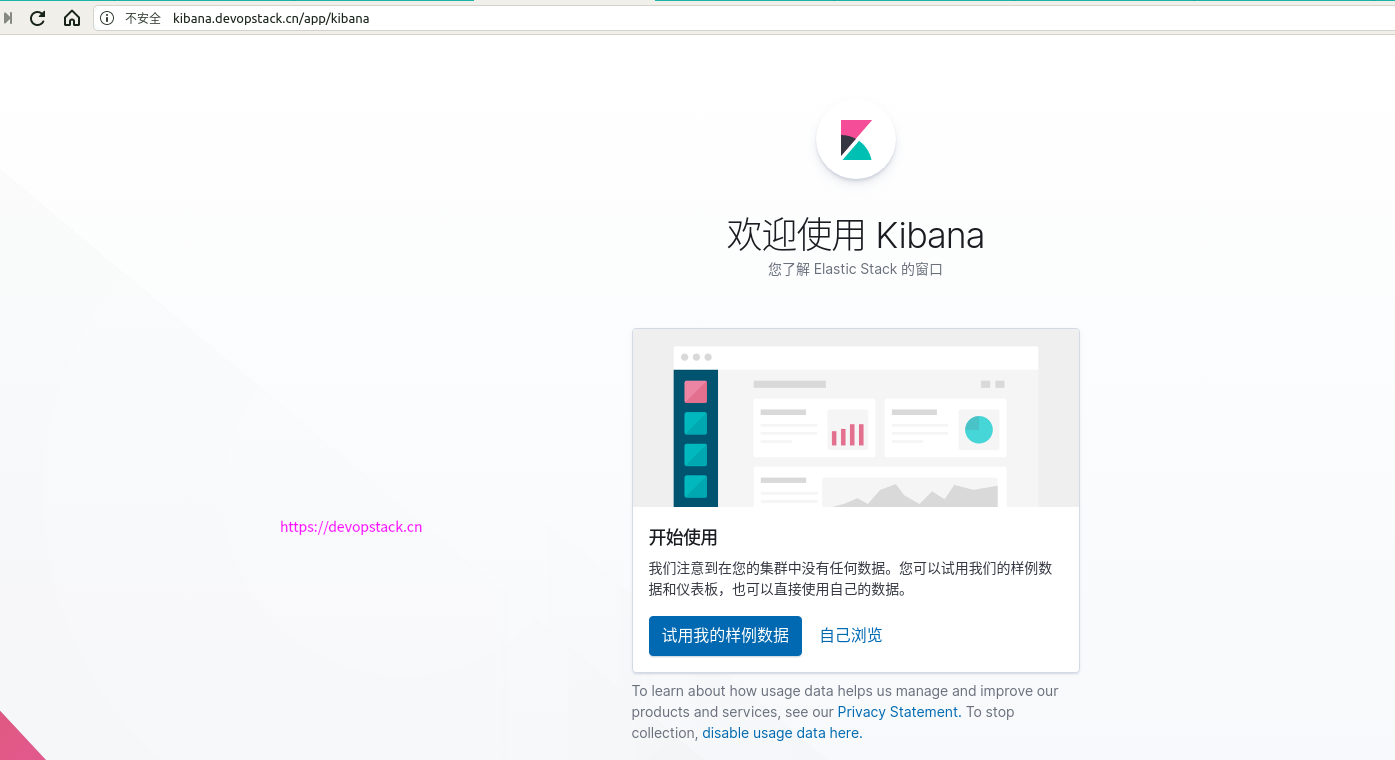
访问浏览器查看
3 日志采集配置
3.1 Node上部署一个filebeat采集器采集容器日志
由于这种 agent 必须在每个节点上运行,所以直接使用 DaemonSet 控制器运行该应用程序即可。在节点上运行一个日志收集的 agent 这种方式是最常见的一直方法,因为它只需要在每个节点上运行一个代理程序,并不需要对节点上运行的应用程序进行更改,对应用程序没有任何侵入性,但是这种方法也仅仅适用于收集输出到 stdout 和 stderr 的应用程序日志。
---
apiVersion: v1
kind: ConfigMap
metadata:
name: filebeat-config
namespace: kube-system
labels:
k8s-app: filebeat
data:
filebeat.yml: |-
filebeat.config:
inputs:
# Mounted `filebeat-inputs` configmap:
path: {path.config}/inputs.d/*.yml
# Reload inputs configs as they change:
reload.enabled: false
modules:
path:{path.config}/modules.d/*.yml
# Reload module configs as they change:
reload.enabled: false
# To enable hints based autodiscover, remove `filebeat.config.inputs` configuration and uncomment this:
#filebeat.autodiscover:
# providers:
# - type: kubernetes
# hints.enabled: true
output.elasticsearch:
hosts: ['{ELASTICSEARCH_HOST:elasticsearch}:{ELASTICSEARCH_PORT:9200}']
---
apiVersion: v1
kind: ConfigMap
metadata:
name: filebeat-inputs
namespace: kube-system
labels:
k8s-app: filebeat
data:
kubernetes.yml: |-
- type: docker
containers.ids:
- "*"
processors:
- add_kubernetes_metadata:
in_cluster: true
---
apiVersion: apps/v1
kind: DaemonSet
metadata:
name: filebeat
namespace: kube-system
labels:
k8s-app: filebeat
spec:
selector:
matchLabels:
k8s-app: filebeat
template:
metadata:
labels:
k8s-app: filebeat
spec:
serviceAccountName: filebeat
terminationGracePeriodSeconds: 30
containers:
- name: filebeat
image: elastic/filebeat:7.5.0
args: [
"-c", "/etc/filebeat.yml",
"-e",
]
env:
- name: ELASTICSEARCH_HOST
value: elasticsearch
- name: ELASTICSEARCH_PORT
value: "9200"
securityContext:
runAsUser: 0
# If using Red Hat OpenShift uncomment this:
#privileged: true
resources:
limits:
memory: 200Mi
requests:
cpu: 100m
memory: 100Mi
volumeMounts:
- name: config
mountPath: /etc/filebeat.yml
readOnly: true
subPath: filebeat.yml
- name: inputs
mountPath: /usr/share/filebeat/inputs.d
readOnly: true
- name: data
mountPath: /usr/share/filebeat/data
- name: varlibdockercontainers
mountPath: /var/lib/docker/containers
readOnly: true
volumes:
- name: config
configMap:
defaultMode: 0600
name: filebeat-config
- name: varlibdockercontainers
hostPath:
path: /var/lib/docker/containers
- name: inputs
configMap:
defaultMode: 0600
name: filebeat-inputs
# data folder stores a registry of read status for all files, so we don't send everything again on a Filebeat pod restart
- name: data
hostPath:
path: /var/lib/filebeat-data
type: DirectoryOrCreate
---
apiVersion: rbac.authorization.k8s.io/v1beta1
kind: ClusterRoleBinding
metadata:
name: filebeat
subjects:
- kind: ServiceAccount
name: filebeat
namespace: kube-system
roleRef:
kind: ClusterRole
name: filebeat
apiGroup: rbac.authorization.k8s.io
---
apiVersion: rbac.authorization.k8s.io/v1beta1
kind: ClusterRole
metadata:
name: filebeat
labels:
k8s-app: filebeat
rules:
- apiGroups: [""] # "" indicates the core API group
resources:
- namespaces
- pods
verbs:
- get
- watch
- list
---
apiVersion: v1
kind: ServiceAccount
metadata:
name: filebeat
namespace: kube-system
labels:
k8s-app: filebeat
---
这里指定了es的路径
output.elasticsearch:
hosts: ['{ELASTICSEARCH_HOST:elasticsearch}:{ELASTICSEARCH_PORT:9200}']
这里是一个处理器,他会自动的为日志添加k8s属性。传统配置日志采集工具重要的参数是什么呢?日志路径、日志源、写正则,格式化日志。add_kubernetes_metadata这个处理器可以自动的为k8s添加日志属性信息
data:
kubernetes.yml: |-
- type: docker
containers.ids:
- "*"
processors:
- add_kubernetes_metadata:
in_cluster: true
这里使用了hostpath挂载了docker的工作目录
- name: varlibdockercontainers
hostPath:
path: /var/lib/docker/containers
执行创建filebeat
[root@k8s-master01 elk]# kubectl apply -f filebeat-kubernetes.yaml
configmap/filebeat-config created
configmap/filebeat-inputs created
daemonset.apps/filebeat created
clusterrolebinding.rbac.authorization.k8s.io/filebeat created
clusterrole.rbac.authorization.k8s.io/filebeat created
serviceaccount/filebeat created
查看filebeat情况
[root@k8s-master01 elk]# kubectl get pods -n kube-system -o wide |grep filebeat
filebeat-7bscr 1/1 Running 0 7m25s 10.244.5.51 k8s-node01 <none> <none>
filebeat-crptr 1/1 Running 0 7m24s 10.244.4.4 k8s-node04 <none> <none>
filebeat-htnzp 1/1 Running 0 7m25s 10.244.2.88 k8s-node02 <none> <none>
filebeat-tsksr 1/1 Running 5 3m10s 10.244.3.16 k8s-node03 <none> <none>
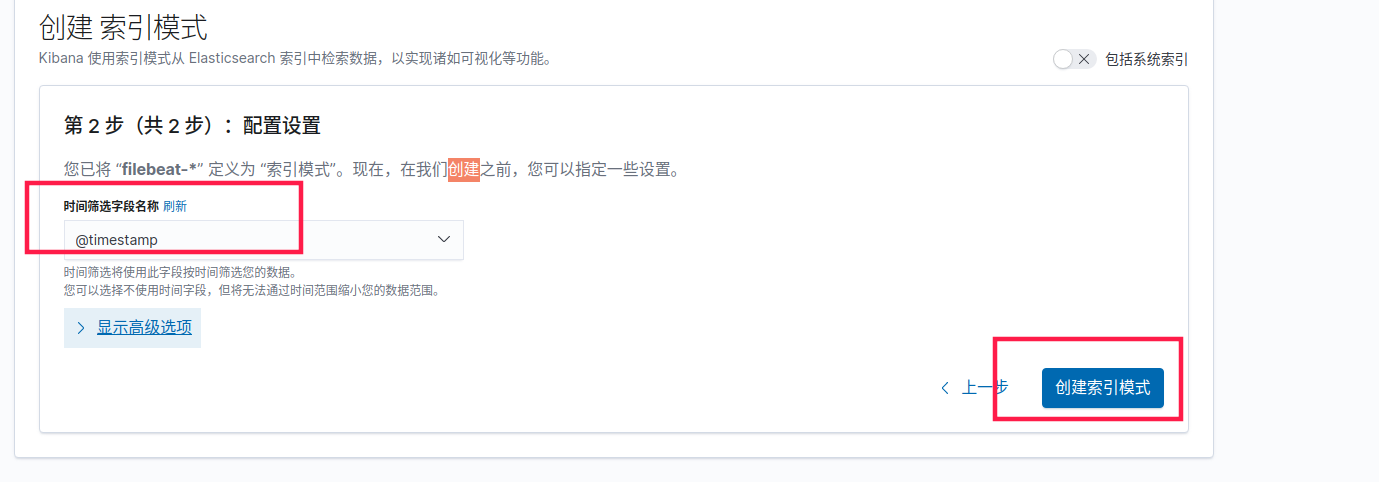
在kibanan上创建索引采集日志
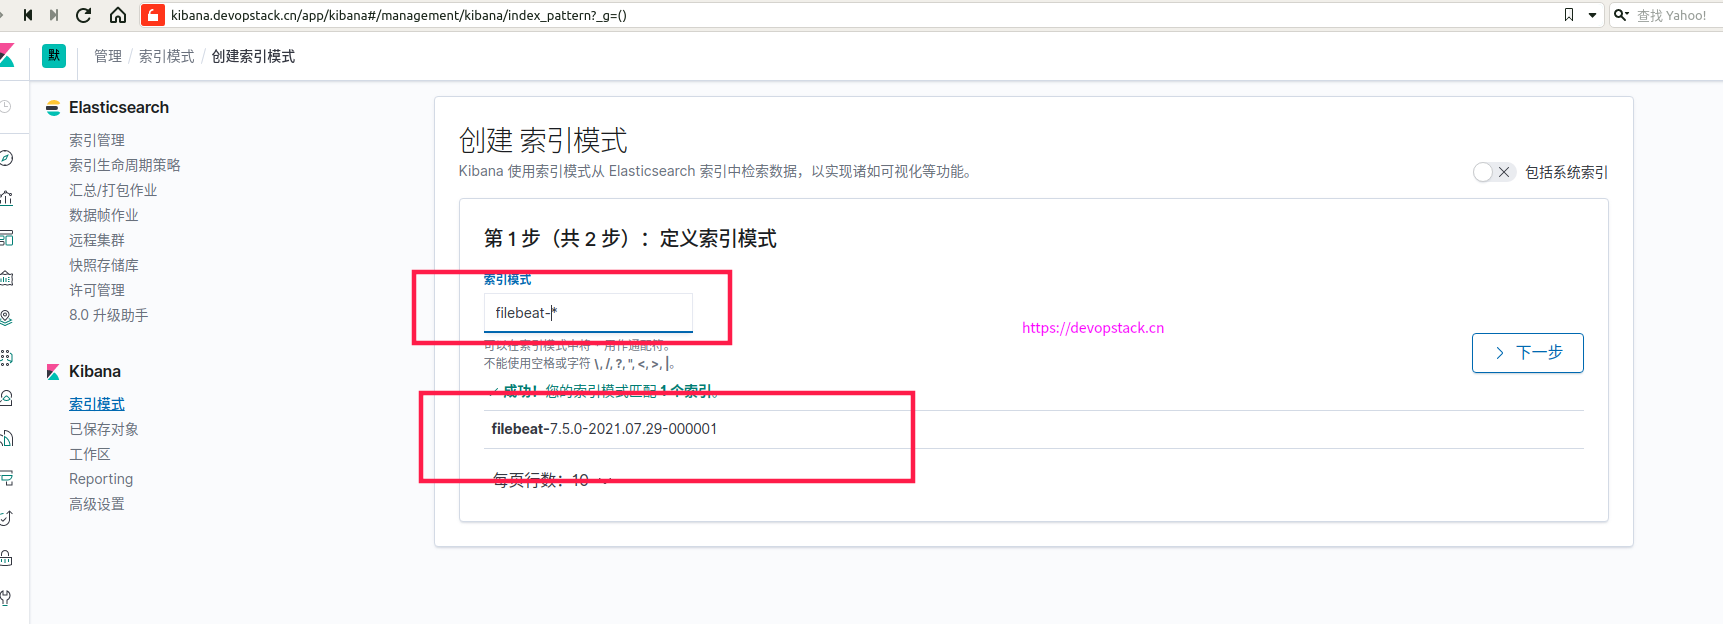
选择时间筛选字段名称
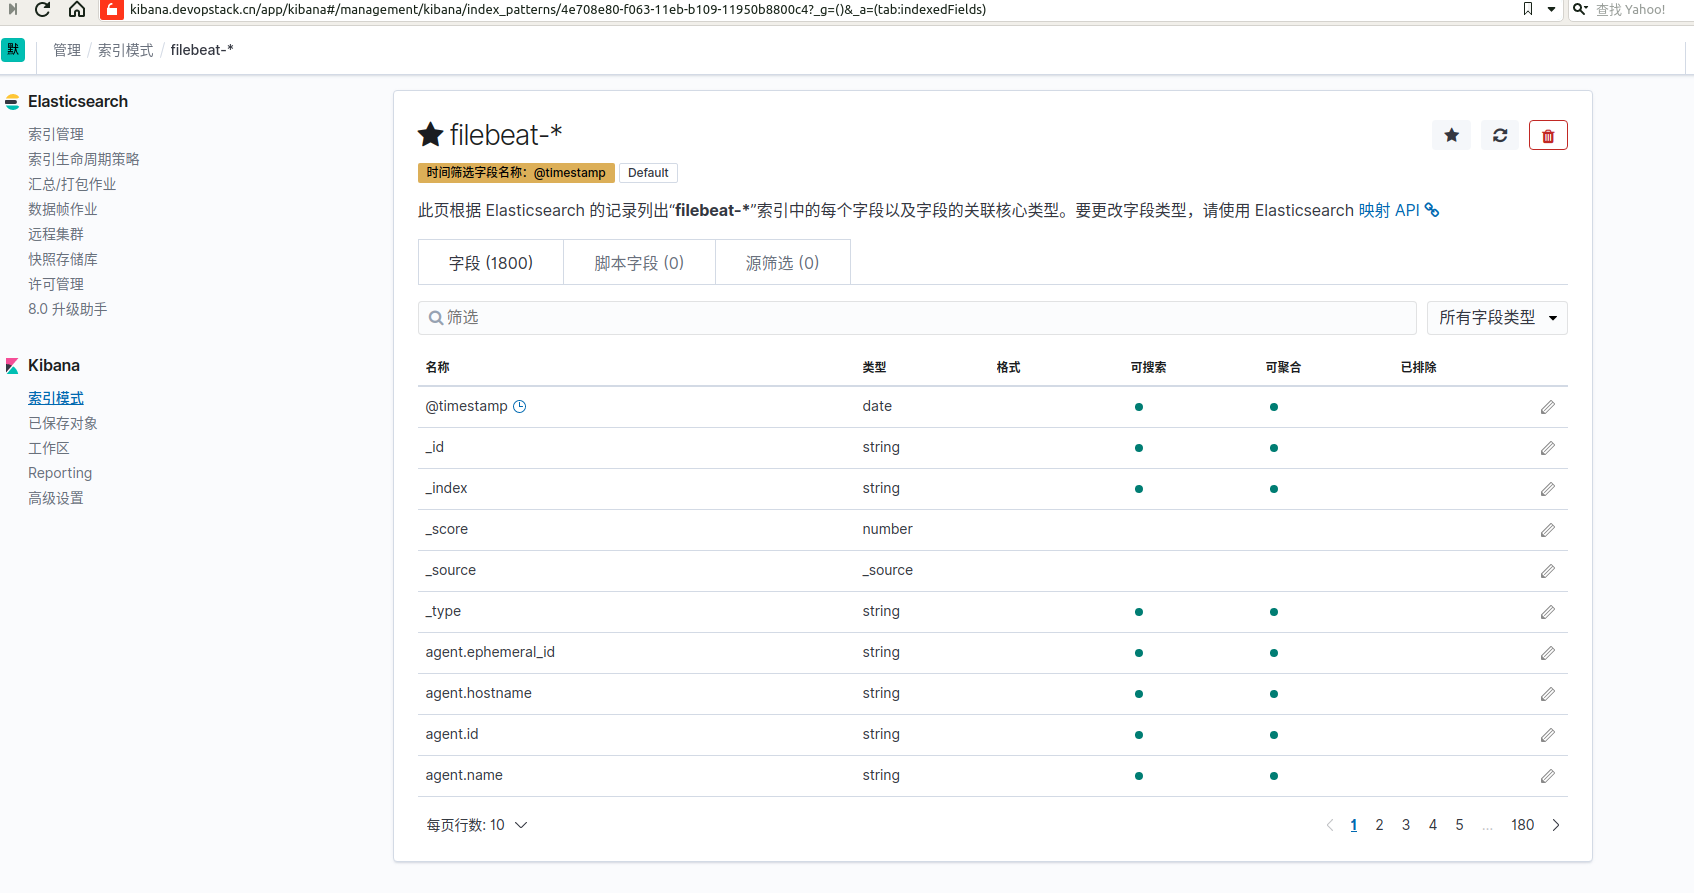
如图已创建好索引
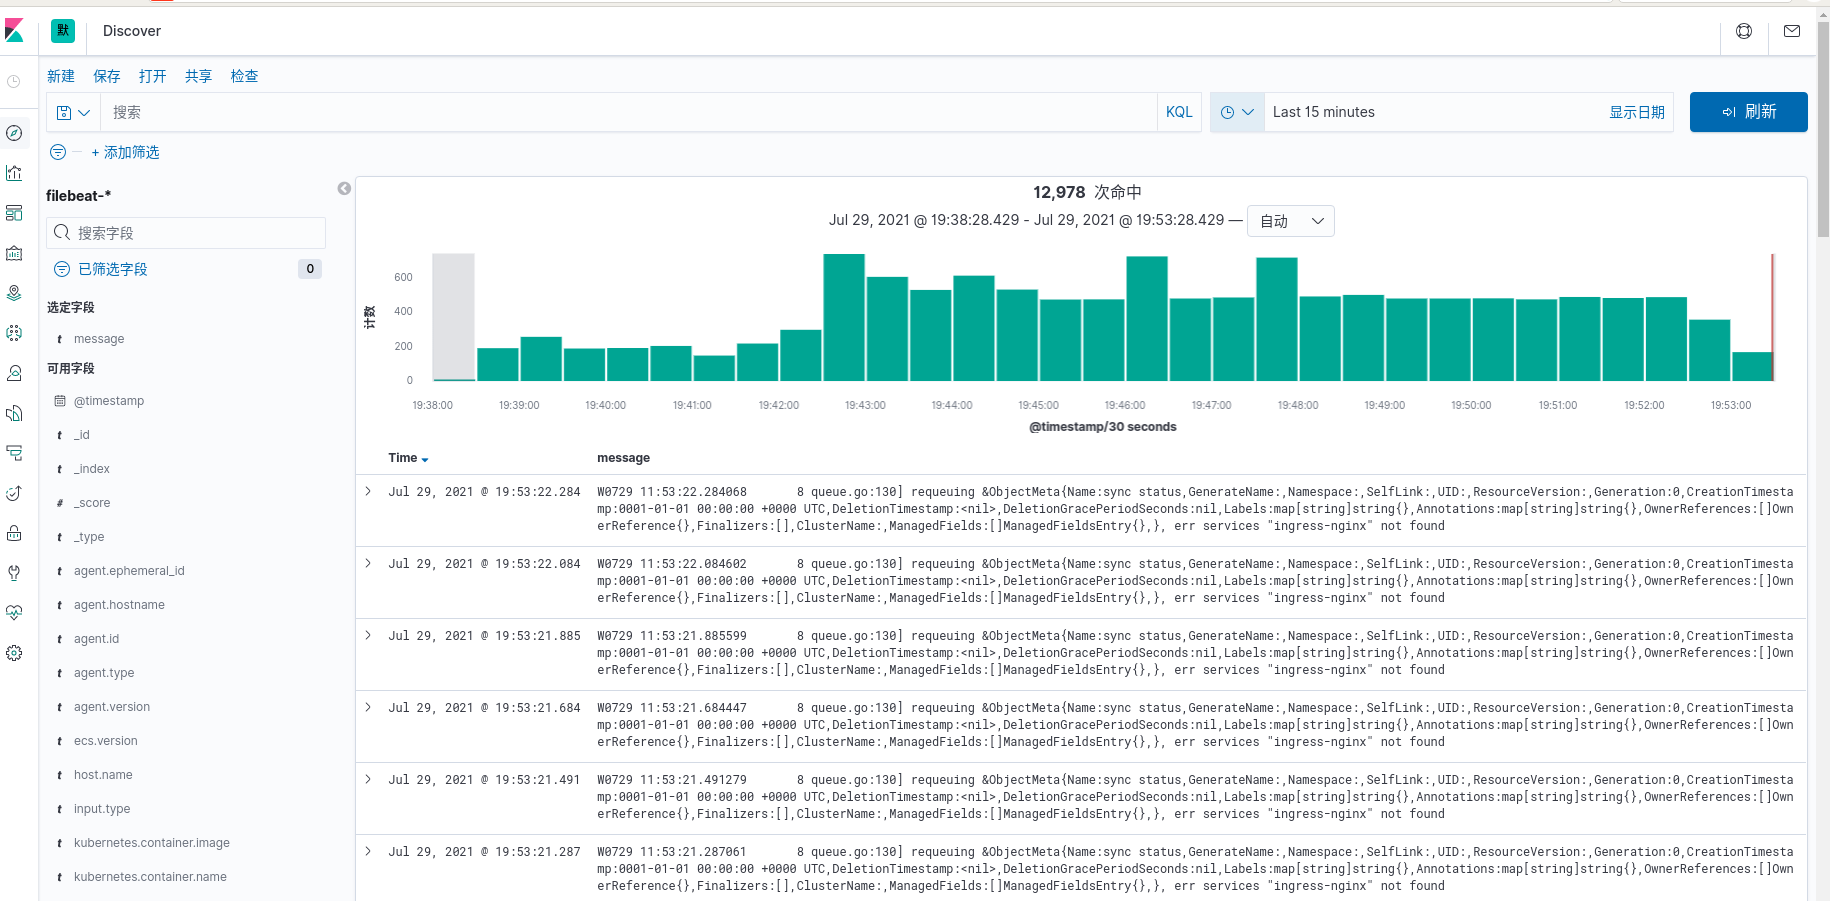
如图,我们已经把容器中的输出日志收集出来了
查看日志是否被收集到
[root@k8s-master01 elk]# curl 10.244.5.43
<html>
<head><title>403 Forbidden</title></head>
<body>
<center><h1>403 Forbidden</h1></center>
<hr><center>nginx/1.16.1</center>
</body>
</html>
[root@k8s-master01 elk]# curl 10.244.5.43
<html>
<head><title>403 Forbidden</title></head>
<body>
<center><h1>403 Forbidden</h1></center>
<hr><center>nginx/1.16.1</center>
</body>
</html>
[root@k8s-master01 elk]# curl 10.244.5.43
<html>
<head><title>403 Forbidden</title></head>
<body>
<center><h1>403 Forbidden</h1></center>
<hr><center>nginx/1.16.1</center>
</body>
</html>
[root@k8s-master01 elk]# curl 10.244.5.43
<html>
<head><title>403 Forbidden</title></head>
<body>
<center><h1>403 Forbidden</h1></center>
<hr><center>nginx/1.16.1</center>
</body>
</html>
[root@k8s-master01 elk]#
[root@k8s-master01 elk]# kubectl logs -f  nginx-0
2021/07/29 11:56:38 [error] 7#7: *1 directory index of "/usr/share/nginx/html/" is forbidden, client: 10.244.0.0, server: localhost, request: "GET / HTTP/1.1", host: "10.244.5.43"
10.244.0.0 - - [29/Jul/2021:11:56:38 +0000] "GET / HTTP/1.1" 403 153 "-" "curl/7.29.0" "-"
2021/07/29 11:56:40 [error] 7#7: *2 directory index of "/usr/share/nginx/html/" is forbidden, client: 10.244.0.0, server: localhost, request: "GET / HTTP/1.1", host: "10.244.5.43"
10.244.0.0 - - [29/Jul/2021:11:56:40 +0000] "GET / HTTP/1.1" 403 153 "-" "curl/7.29.0" "-"
2021/07/29 11:56:41 [error] 7#7: *3 directory index of "/usr/share/nginx/html/" is forbidden, client: 10.244.0.0, server: localhost, request: "GET / HTTP/1.1", host: "10.244.5.43"
10.244.0.0 - - [29/Jul/2021:11:56:41 +0000] "GET / HTTP/1.1" 403 153 "-" "curl/7.29.0" "-"
2021/07/29 11:56:41 [error] 7#7: *4 directory index of "/usr/share/nginx/html/" is forbidden, client: 10.244.0.0, server: localhost, request: "GET / HTTP/1.1", host: "10.244.5.43"
10.244.0.0 - - [29/Jul/2021:11:56:41 +0000] "GET / HTTP/1.1" 403 153 "-" "curl/7.29.0" "-"

如图,我们访问日志已被收集到

3.2 采集k8s组件相关日志
收集/var/log/message的日志,在所有node上部署一个filebeat,也就是用daemonsets去部署,挂载宿主机的messages文件到容器,编写配置文件去读message文件就可以了.
[root@k8s-master01 elk]# cat k8s-logs.yaml
apiVersion: v1
kind: ConfigMap
metadata:
name: k8s-logs-filebeat-config
namespace: kube-system
data:
filebeat.yml: |
filebeat.inputs:
- type: log
paths:
- /var/log/messages
fields:
app: k8s
type: module
fields_under_root: true
setup.ilm.enabled: false
setup.template.name: "k8s-module"
setup.template.pattern: "k8s-module-*"
output.elasticsearch:
hosts: ['elasticsearch-0.elasticsearch.kube-system:9200']
index: "k8s-module-%{+yyyy.MM.dd}"
---
apiVersion: apps/v1
kind: DaemonSet
metadata:
name: k8s-logs
namespace: kube-system
spec:
selector:
matchLabels:
project: k8s
app: filebeat
template:
metadata:
labels:
project: k8s
app: filebeat
spec:
containers:
- name: filebeat
image: elastic/filebeat:7.5.0
args: [
"-c", "/etc/filebeat.yml",
"-e",
]
resources:
requests:
cpu: 100m
memory: 100Mi
limits:
cpu: 500m
memory: 500Mi
securityContext:
runAsUser: 0
volumeMounts:
- name: filebeat-config
mountPath: /etc/filebeat.yml
subPath: filebeat.yml
- name: k8s-logs
mountPath: /var/log/messages
volumes:
- name: k8s-logs
hostPath:
path: /var/log/messages
- name: filebeat-config
configMap:
name: k8s-logs-filebeat-config
执行yaml,收集k8s组件日志.
[root@k8s-master01 elk]# kubectl apply -f k8s-logs.yaml
configmap/k8s-logs-filebeat-config created
daemonset.apps/k8s-logs created
[root@k8s-master01 elk]# kubectl get pods -n kube-system -o wide |grep k8s-log
k8s-logs-65mqv 1/1 Running 0 5m5s 10.244.4.5 k8s-node04 <none> <none>
k8s-logs-9jmcs 1/1 Running 0 5m5s 10.244.3.21 k8s-node03 <none> <none>
k8s-logs-t49qg 1/1 Running 0 5m5s 10.244.2.89 k8s-node02 <none> <none>
k8s-logs-zndbz 1/1 Running 0 5m5s 10.244.5.52 k8s-node01 <none> <none>
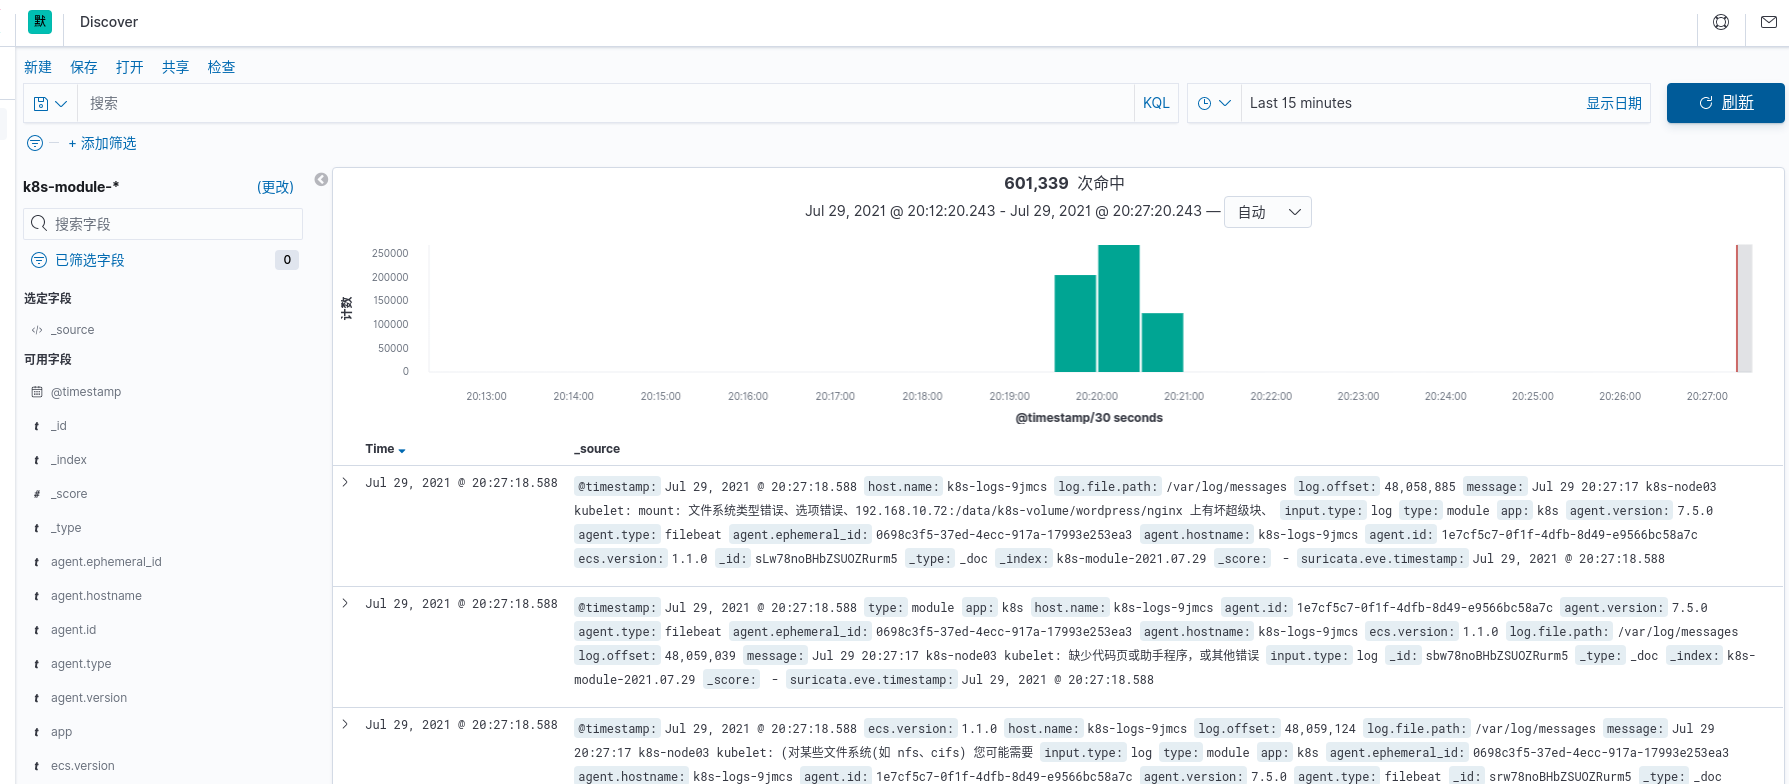
在kibana上创建索引,展示收集的k8s组件日志
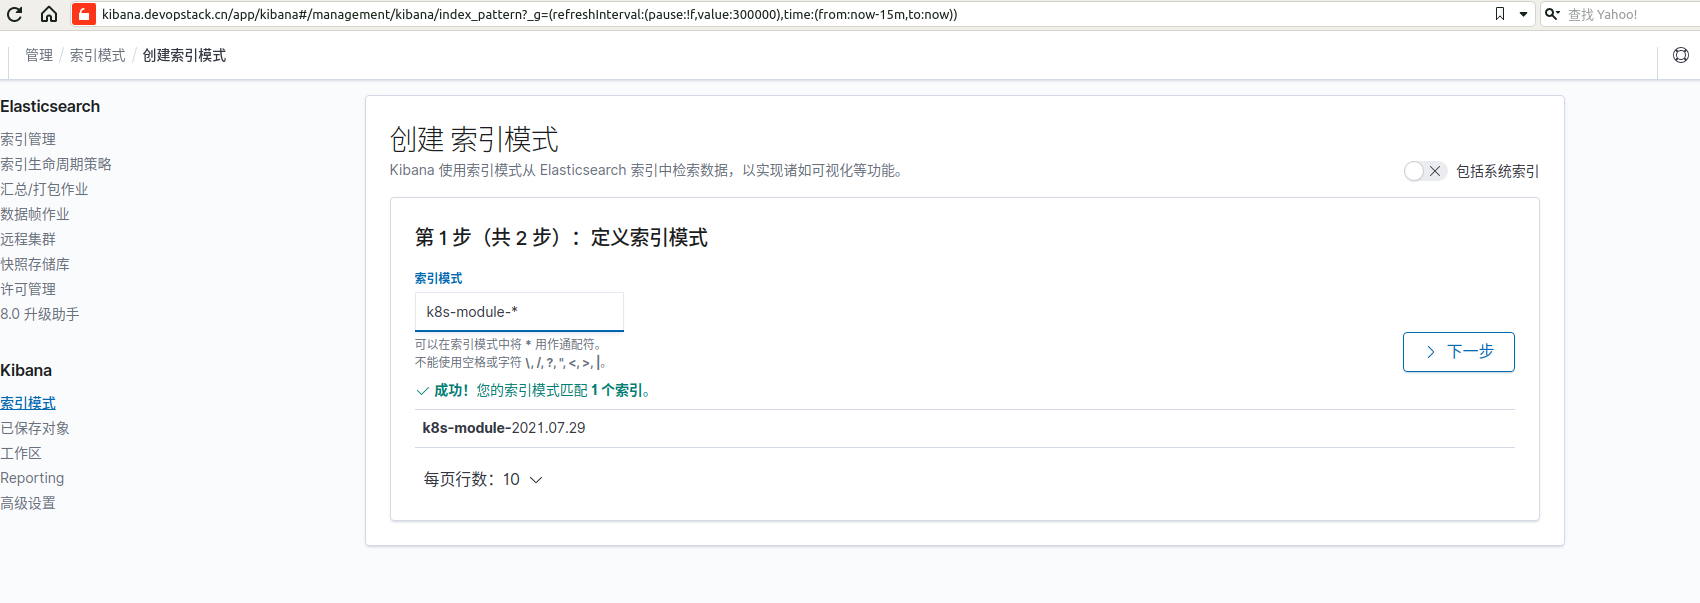
如图 已经创建好k8s组件索引
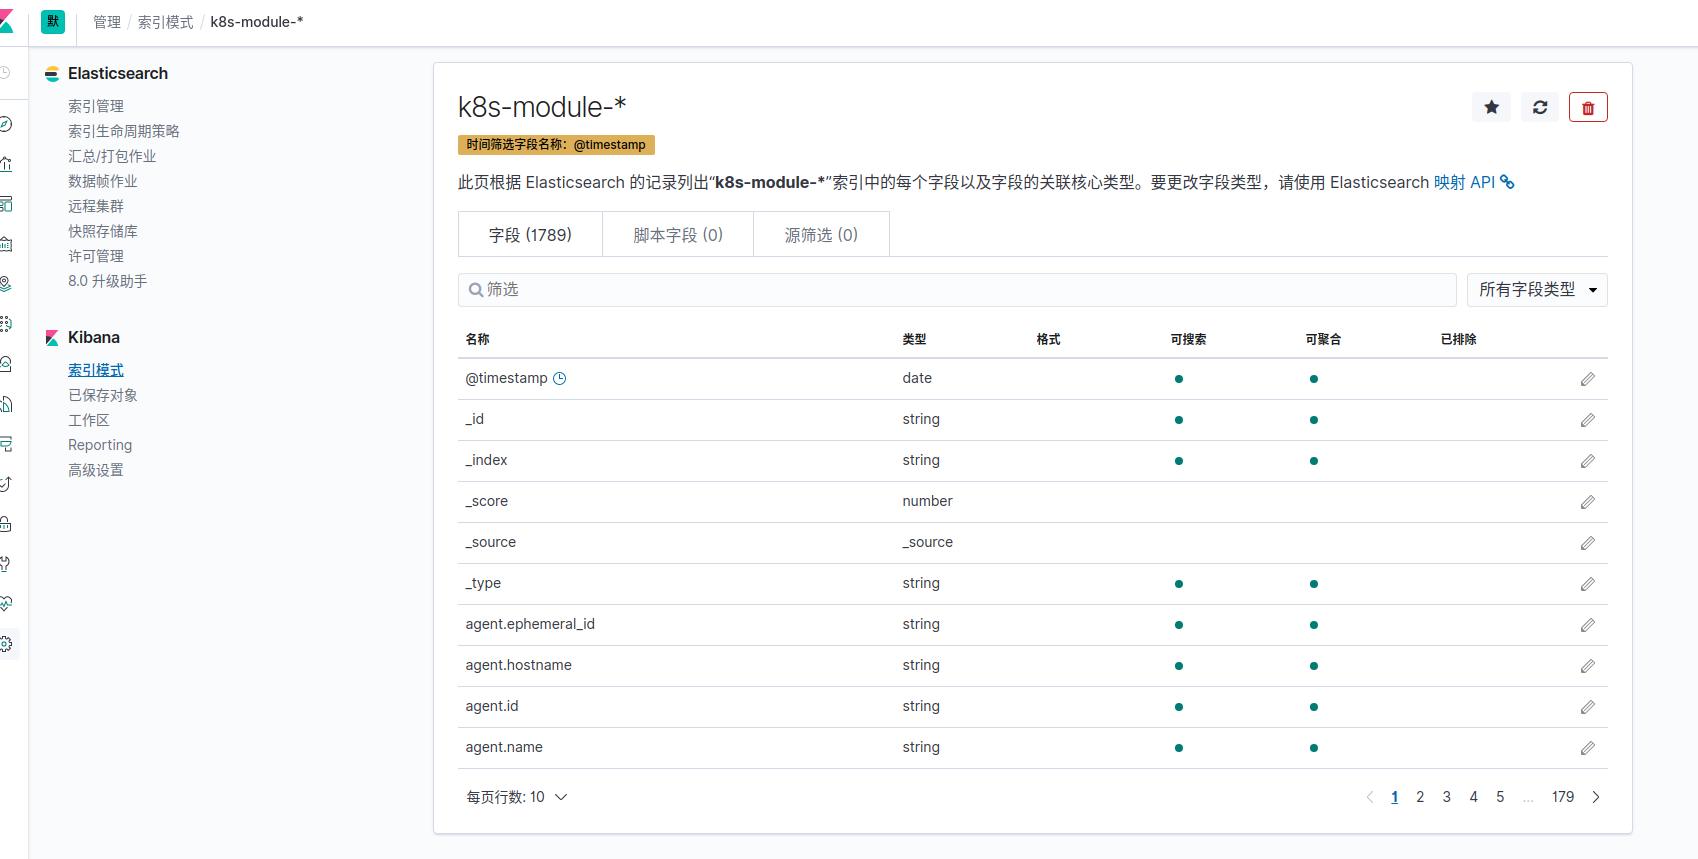
如图 ,已经可以展示收集到的k8s组件日志了
查看污点
[root@k8s-master01 elk]# kubectl describe node | grep Taint
Taints:             node-role.kubernetes.io/master:NoSchedule
Taints:             <none>
Taints:             <none>
Taints:             <none>
Taints:             <none>

收集master上的日志,要设置节点容忍
      tolerations:
      - key: "node-role.kubernetes.io/master"
        operator: "Exists"
        effect: "NoSchedule"

查看 已经收集k8s master节点日志了
[root@k8s-master01 elk]# kubectl get pods -n kube-system -o wide |grep k8s-log
k8s-logs-2d75k                         0/1     ContainerCreating   0          78s     <none>          k8s-node02     <none>           <none>
k8s-logs-bc7n8                         0/1     ContainerCreating   0          78s     <none>          k8s-node04     <none>           <none>
k8s-logs-dqwvv                         1/1     Running             0          78s     10.244.5.54     k8s-node01     <none>           <none>
k8s-logs-h7bjz                         1/1     Running             0          78s     10.244.3.23     k8s-node03     <none>           <none>
k8s-logs-x6vrv                         1/1     Running             0          78s     10.244.0.46     k8s-master01   <none>           <none>
3.3 Pod中附加专用日志收集的容器
在Pod中包含一个sidecar容器来收集应用日志,通过在pod中注入一个日志收集的容器来采集pod的日志,以一个php-demo的应用为例,使用emptyDir的方式把日志目录共享给采集器的容器收集,编写nginx-deployment.yaml ,直接在pod中加入filebeat的容器,并且自定义索引为nginx-access-%{+yyyy.MM.dd}
部署资源yaml如下
apiVersion: apps/v1
kind: Deployment
metadata:
name: php-demo
namespace: blog
spec:
replicas: 3
selector:
matchLabels:
project: www
app: php-demo
template:
metadata:
labels:
project: www
app: php-demo
spec:
containers:
- name: nginx
image: lizhenliang/nginx-php
imagePullPolicy: Always
ports:
- containerPort: 80
name: web
protocol: TCP
resources:
requests:
cpu: 0.5
memory: 256Mi
limits:
cpu: 1
memory: 1Gi
resources:
requests:
cpu: 0.5
memory: 256Mi
limits:
cpu: 1
memory: 1Gi
livenessProbe:
httpGet:
path: /status.php
port: 80
initialDelaySeconds: 6
timeoutSeconds: 20
volumeMounts:
- name: nginx-logs
mountPath: /usr/local/nginx/logs
- name: filebeat
image: elastic/filebeat:7.5.0
args: [
"-c", "/etc/filebeat.yml",
"-e",
]
resources:
limits:
memory: 500Mi
requests:
cpu: 100m
memory: 100Mi
securityContext:
runAsUser: 0
volumeMounts:
- name: filebeat-config
mountPath: /etc/filebeat.yml
subPath: filebeat.yml
- name: nginx-logs
mountPath: /usr/local/nginx/logs
volumes:
- name: nginx-logs
emptyDir: {}
- name: filebeat-config
configMap:
name: filebeat-nginx-config
---
apiVersion: v1
kind: ConfigMap
metadata:
name: filebeat-nginx-config
namespace: kube-system
data:
filebeat.yml: |-
filebeat.inputs:
- type: log
paths:
- /usr/local/nginx/logs/access.log
# tags: ["access"]
fields:
app: www
type: nginx-access
fields_under_root: true
setup.ilm.enabled: false
setup.template.name: "nginx-access"
setup.template.pattern: "nginx-access-*"
output.elasticsearch:
hosts: ['elasticsearch.kube-system:9200']
index: "nginx-access-%{+yyyy.MM.dd}"
部署测试
如下,容器已经起来了
[root@k8s-master01 elk]# kubectl get pods -n blog
NAME READY STATUS RESTARTS AGE
php-demo-7dfd9bd5b9-56qfs 2/2 Running 0 6m14s
php-demo-7dfd9bd5b9-76dqf 2/2 Running 0 6m14s
php-demo-7dfd9bd5b9-vj8lr 2/2 Running 0 6m14s
创建测试数据测试
[root@k8s-master01 elk]# curl 10.244.2.92/status.php
ok[root@k8s-master01 elk]# curl 10.244.2.92/status.php
ok[root@k8s-master01 elk]# curl 10.244.2.92/status.php
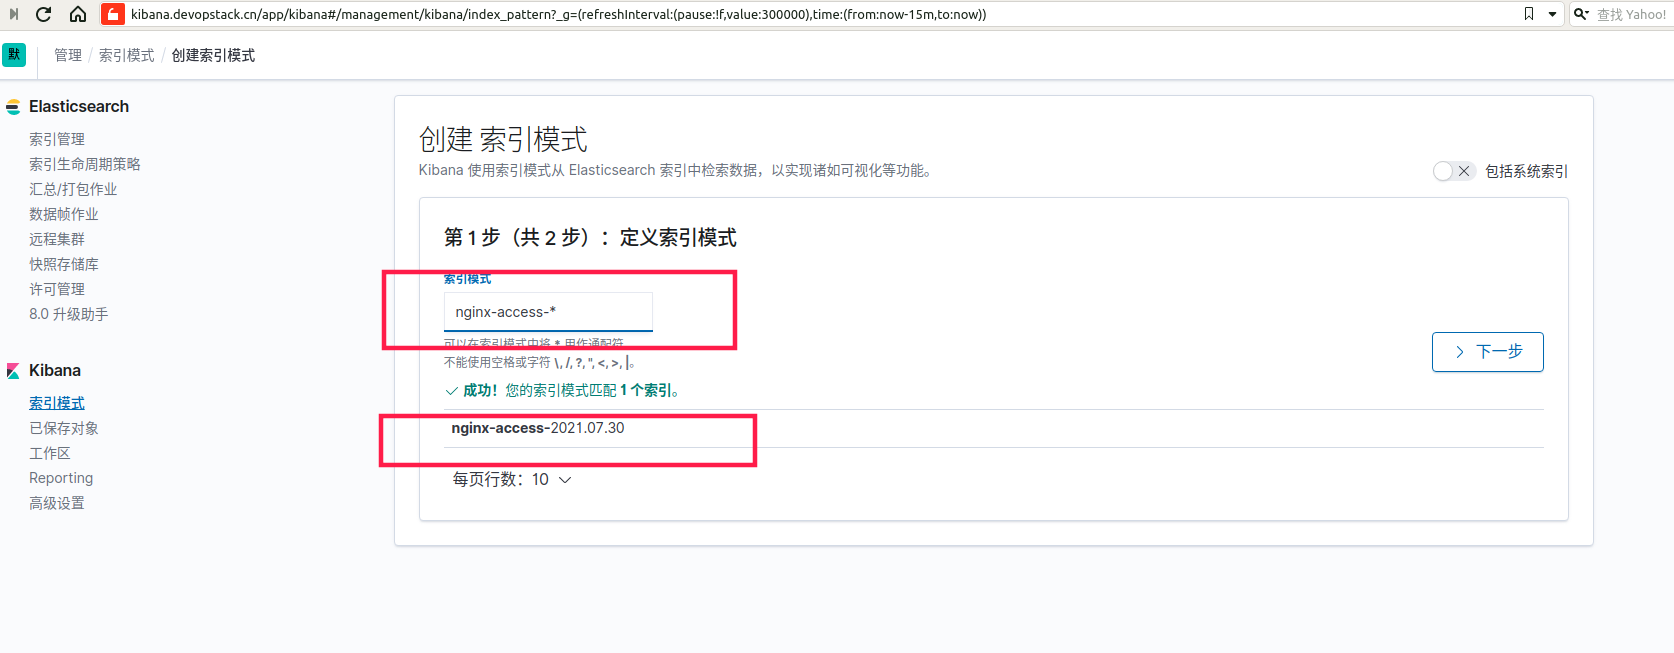
在kibana上创建索引,查看数据
ok[root@k8s-master01 elk]# kubectl exec -it php-demo-7dfd9bd5b9-56qfs /bin/bash -n blog
kubectl exec [POD] [COMMAND] is DEPRECATED and will be removed in a future version. Use kubectl kubectl exec [POD] -- [COMMAND] instead.
Defaulting container name to nginx.
Use 'kubectl describe pod/php-demo-7dfd9bd5b9-56qfs -n blog' to see all of the containers in this pod.
[root@php-demo-7dfd9bd5b9-56qfs local]# cd nginx/
[root@php-demo-7dfd9bd5b9-56qfs nginx]# ll
total 0
drwx------ 2 nobody root 6 Jul 30 10:18 client_body_temp
drwxr-xr-x 1 root root 24 Jan 2 2019 conf
drwx------ 2 nobody root 6 Jul 30 10:18 fastcgi_temp
drwxr-xr-x 2 root root 43 Jan 2 2019 html
drwxrwxrwx 2 root root 41 Jul 30 10:18 logs
drwx------ 2 nobody root 6 Jul 30 10:18 proxy_temp
drwxr-xr-x 2 root root 19 Jan 2 2019 sbin
drwx------ 2 nobody root 6 Jul 30 10:18 scgi_temp
drwx------ 2 nobody root 6 Jul 30 10:18 uwsgi_temp
[root@php-demo-7dfd9bd5b9-56qfs nginx]# cd logs/
[root@php-demo-7dfd9bd5b9-56qfs logs]# ll
total 28
-rw-r--r-- 1 root root 4450 Jul 30 10:24 access.log
-rw-r--r-- 1 root root 16741 Jul 30 10:24 error.log
[root@php-demo-7dfd9bd5b9-56qfs logs]# tail -100f access.log
10.244.2.1 - - [30/Jul/2021:10:18:51 +0800] "GET /status.php HTTP/1.1" 200 33 "-" "kube-probe/1.18"
10.244.2.1 - - [30/Jul/2021:10:19:01 +0800] "GET /status.php HTTP/1.1" 200 33 "-" "kube-probe/1.18"
10.244.2.1 - - [30/Jul/2021:10:19:11 +0800] "GET /status.php HTTP/1.1" 200 33 "-" "kube-probe/1.18"
10.244.2.1 - - [30/Jul/2021:10:19:21 +0800] "GET /status.php HTTP/1.1" 200 33 "-" "kube-probe/1.18"
10.244.2.1 - - [30/Jul/2021:10:19:31 +0800] "GET /status.php HTTP/1.1" 200 33 "-" "kube-probe/1.18"
10.244.2.1 - - [30/Jul/2021:10:19:41 +0800] "GET /status.php HTTP/1.1" 200 33 "-" "kube-probe/1.18"
10.244.2.1 - - [30/Jul/2021:10:19:51 +0800] "GET /status.php HTTP/1.1" 200 33 "-" "kube-probe/1.18"
10.244.2.1 - - [30/Jul/2021:10:20:01 +0800] "GET /status.php HTTP/1.1" 200 33 "-" "kube-probe/1.18"
10.244.2.1 - - [30/Jul/2021:10:20:11 +0800] "GET /status.php HTTP/1.1" 200 33 "-" "kube-probe/1.18"
10.244.2.1 - - [30/Jul/2021:10:20:21 +0800] "GET /status.php HTTP/1.1" 200 33 "-" "kube-probe/1.18"
10.244.2.1 - - [30/Jul/2021:10:20:31 +0800] "GET /status.php HTTP/1.1" 200 33 "-" "kube-probe/1.18"
10.244.2.1 - - [30/Jul/2021:10:20:41 +0800] "GET /status.php HTTP/1.1" 200 33 "-" "kube-probe/1.18"
10.244.0.0 - - [30/Jul/2021:10:20:44 +0800] "GET /10.244.2.92 HTTP/1.1" 404 146 "-" "curl/7.29.0"
10.244.2.1 - - [30/Jul/2021:10:20:51 +0800] "GET /status.php HTTP/1.1" 200 33 "-" "kube-probe/1.18"
10.244.0.0 - - [30/Jul/2021:10:20:53 +0800] "GET /status.php HTTP/1.1" 200 12 "-" "curl/7.29.0"
10.244.0.0 - - [30/Jul/2021:10:20:55 +0800] "GET /status.php HTTP/1.1" 200 12 "-" "curl/7.29.0"
10.244.0.0 - - [30/Jul/2021:10:20:55 +0800] "GET /status.php HTTP/1.1" 200 12 "-" "curl/7.29.0"
查看nginx日志如上
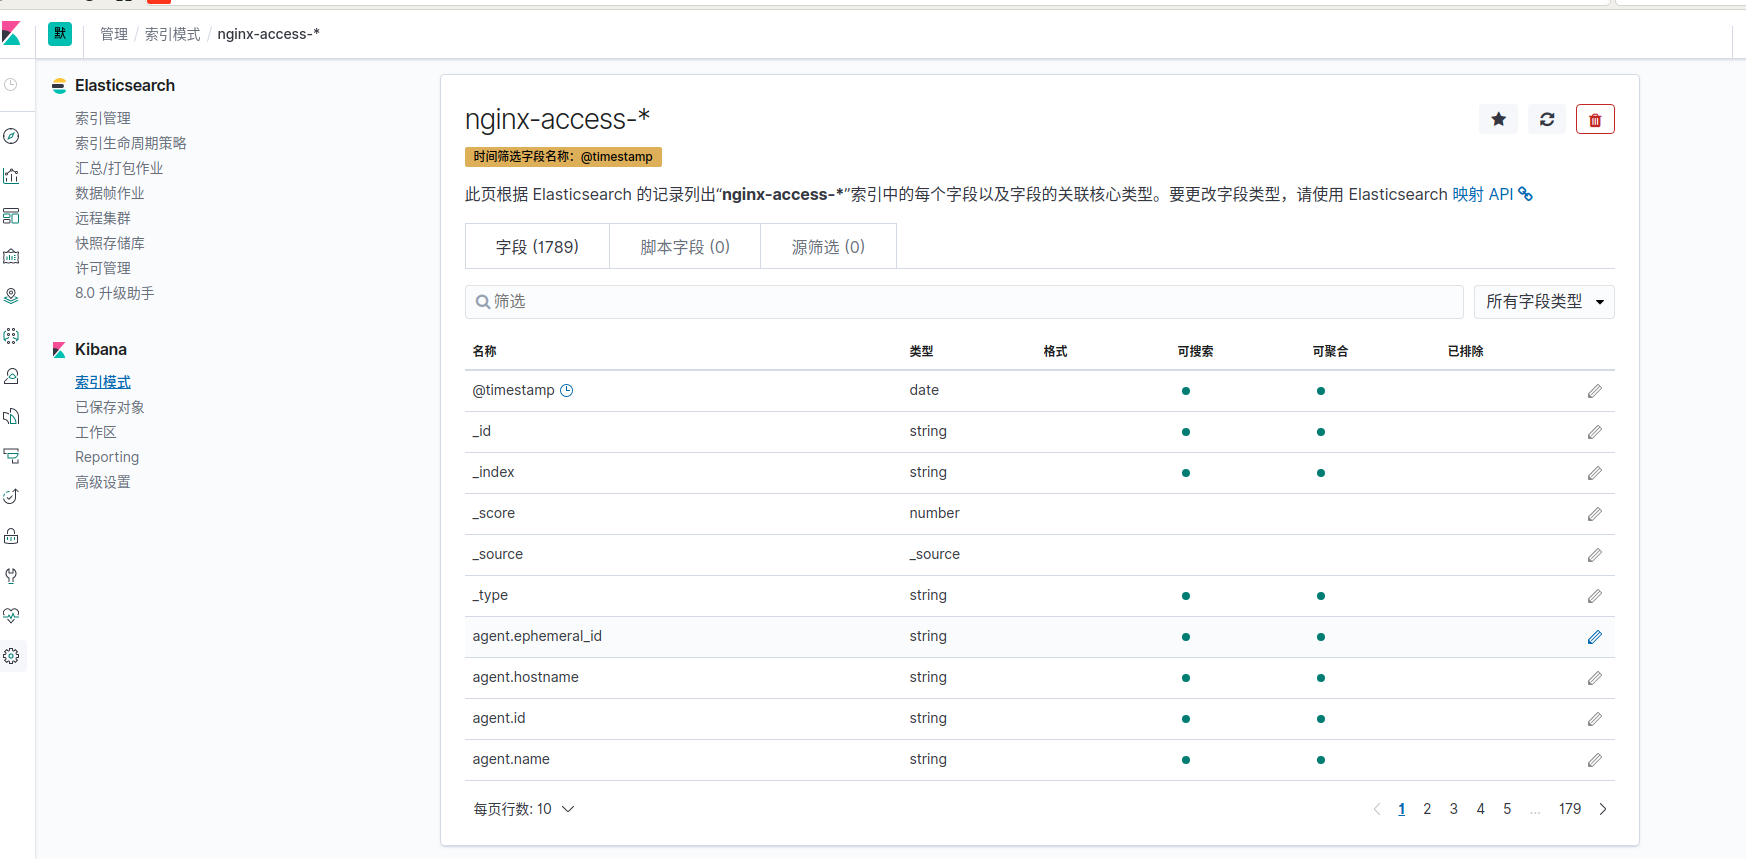
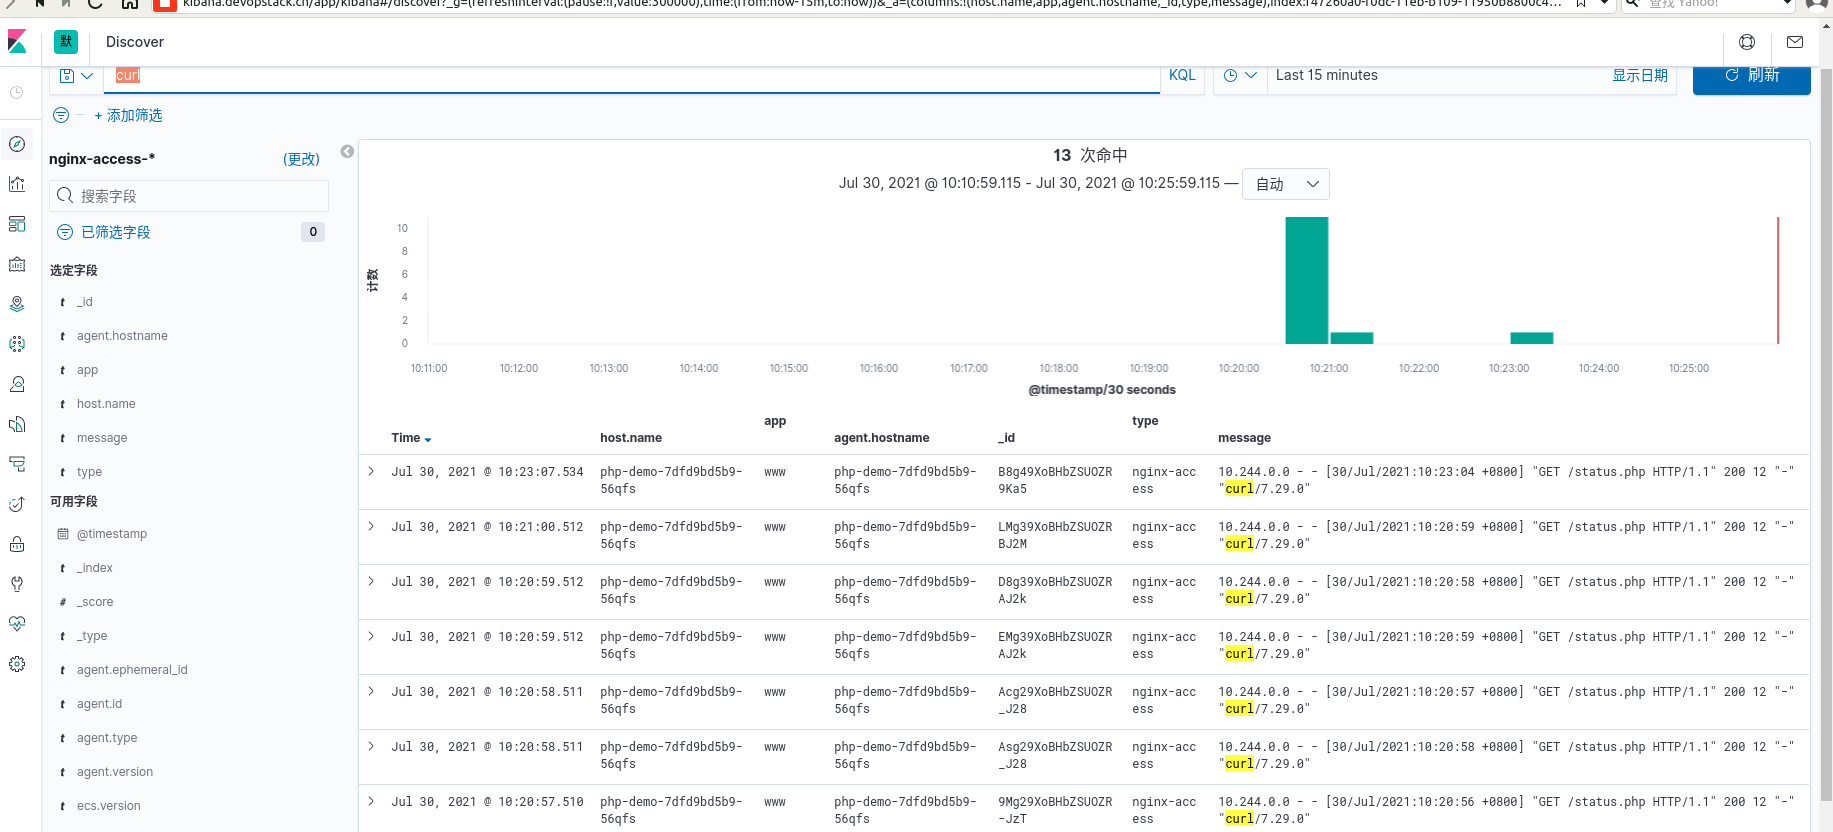
我们在kibana查看我们curl的日志内容如下图,我们已经完成了通过共享日志路径采集项目日志的收集工作.
- 我的微信
- 这是我的微信扫一扫
-

- 我的微信公众号
- 我的微信公众号扫一扫
-