1 下载 mongodb_exporter
wget https://github.com/prometheus/node_exporter/releases/download/v1.2.2/node_exporter-1.2.2.linux-amd64.tar.gz
2 配置 mongodb_exporter
mkdir mongodb_exporter
mv downloads/mongodb_exporter-linux-amd64 mongodb_exporter
3 配置用于监控 mongodb 的账户权限
mongodb admin 库中执行

use admin
db.createUser({
    user: "prometheus",
    pwd: "prometheus",
    roles: [
        { role: "read", db: "admin" },
        { role: "readAnyDatabase", db: "admin" },
        { role: "clusterMonitor", db: "admin" }
    ]
});
4 启动 mongodb_exporter
nohup ./mongodb_exporter --web.listen-address="192.168.88.141:9216" --mongodb.uri "mongodb://prometheus:prometheus@192.168.88.140:27017,192.168.88.141:27017,192.168.88.142:27017" &

配置启动服务
vim /usr/lib/systemd/system/mongodb_exporter.service
[Unit]
Description=mongodb_exporter
Documentation=https://github.com/percona/mongodb_exporter
After=network.target

[Service]
Type=simple
User=prometheus
Environment="MONGODB_URI=mongodb://mongodb_exporter:123456@localhost:27017"
ExecStart=/usr/local/bin/mongodb_exporter --log.level=error \
  --collect.database \
  --collect.collection \
  --collect.topmetrics \
  --collect.indexusage \
  --collect.connpoolstats

Restart=on-failure

[Install]
WantedBy=multi-user.target
5 prometheus配置基于文件的自动发现
  - job_name: 'mongo_cluster'
    file_sd_configs:
      - files: ['/usr/local/prometheus/sd_config/mongo_cluster.yaml']
        refresh_interval: 5s
root@Tech03:/usr/local/prometheus# cat /usr/local/prometheus/sd_config/mongo_cluster.yaml
- targets:
        - "192.168.88.140:9216"
        - "192.168.88.141:9216"
        - "192.168.88.142:9216"
  labels:
          project: mongo
          unitname: "Mongodb_exporter"
          service: mongo
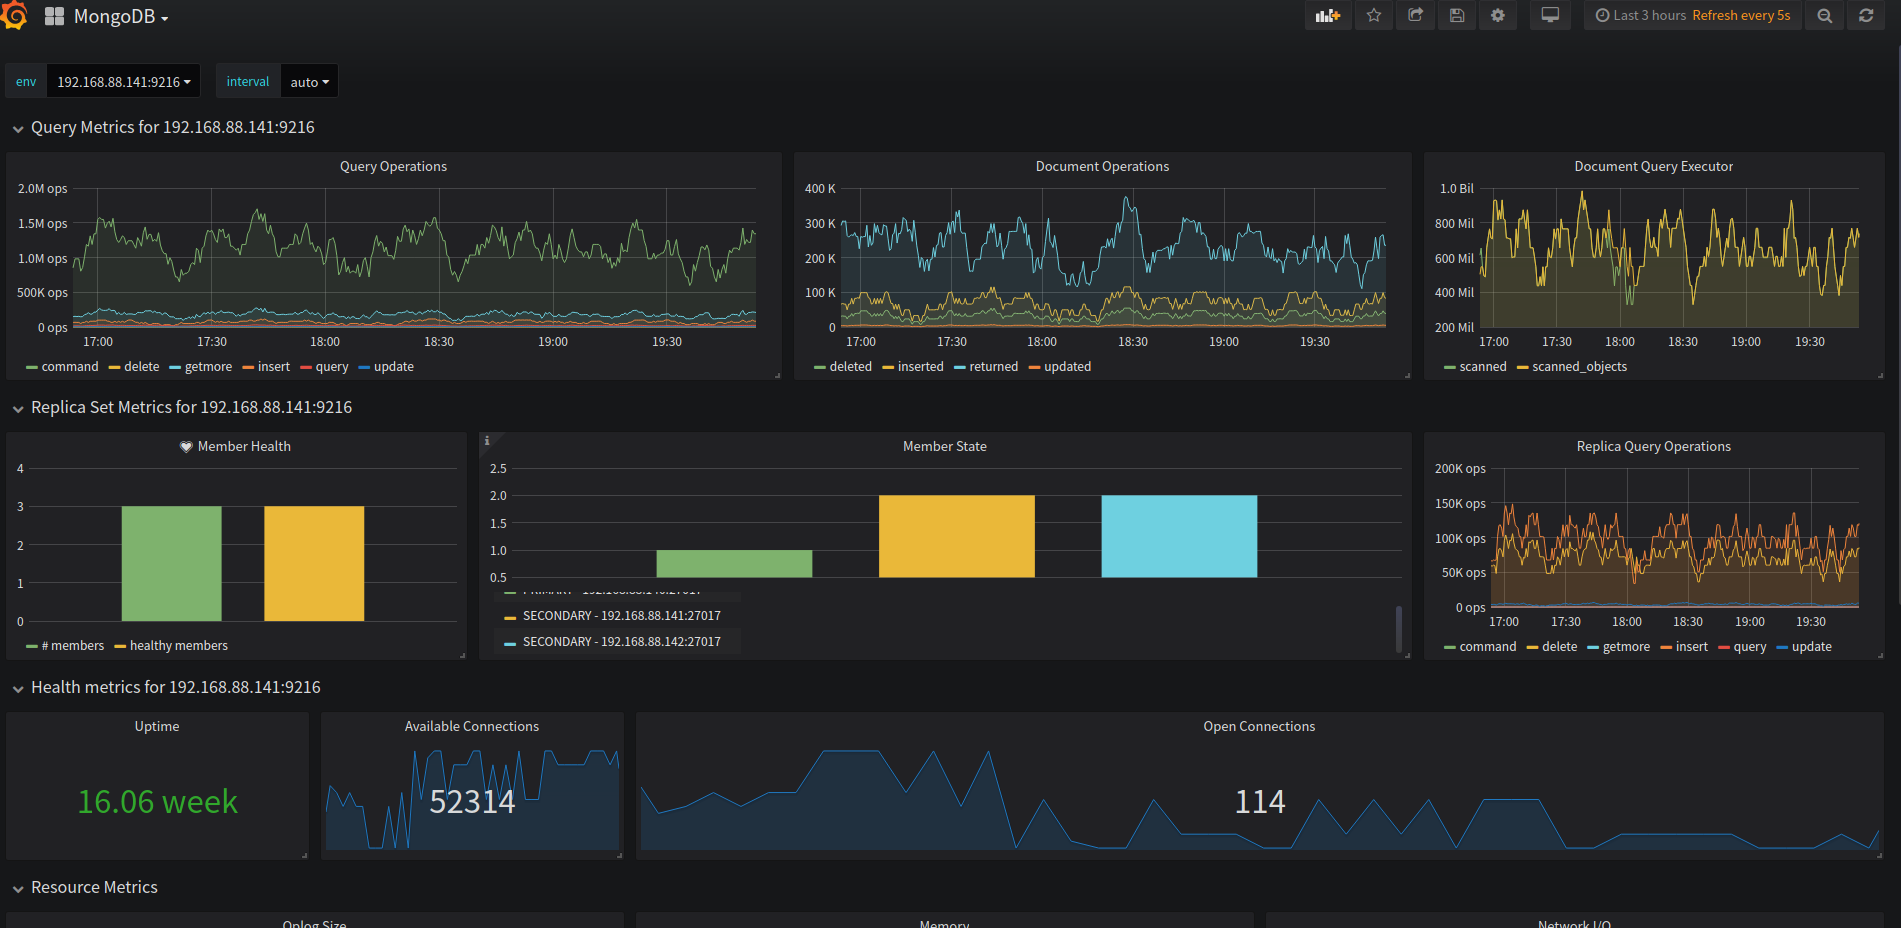
6 grafana配置mongo展示图
导入模板为 2583
展示效果如下图