1 安装Prometheus Server
1.1 通过二进制文件的形式进行安装
wget https://github.com/prometheus/prometheus/releases/download/v2.28.1/prometheus-2.28.1.linux-amd64.tar.gz
[root@prometheus-server ~]# tar -xf prometheus-2.28.1.linux-amd64.tar.gz -C /usr/local/
[root@prometheus-server ~]# ln -s /usr/local/prometheus-2.28.1.linux-amd64/ /usr/local/prometheus
解压后当前目录会包含默认的Prometheus配置文件promethes.yml
[root@prometheus-server prometheus]# mkdir /data
创建服务启动脚本
# cd /usr/lib/systemd/system
[root@prometheus-server system]# cat prometheus.service
[Unit]
Description=Prometheus
Documentation=https://prometheus.io/
After=network.target
[Service]
# Type设置为notify时,服务会不断重启
Type=simple
User=root
Group=root
# --storage.tsdb.path是可选项,默认数据目录在运行目录的./dada目录中
ExecStart=/usr/local/prometheus/prometheus --config.file=/usr/local/prometheus/prometheus.yml --storage.tsdb.path=/data/
Restart=on-failure
[Install]
WantedBy=multi-user.target
启动prometheus
[root@prometheus-server system]# systemctl daemon-reload
[root@prometheus-server system]# systemctl enable prometheus.service
[root@prometheus-server prometheus]# systemctl start prometheus.service
[root@prometheus-server prometheus]# systemctl status prometheus
● prometheus.service - Prometheus
Loaded: loaded (/usr/lib/systemd/system/prometheus.service; enabled; vendor preset: disabled)
Active: active (running) since 日 2021-08-01 12:05:21 CST; 18s ago
Docs: https://prometheus.io/
Main PID: 1604 (prometheus)
CGroup: /system.slice/prometheus.service
└─1604 /usr/local/prometheus/prometheus --config.file=/usr/local/prometheus/prometheus.yml --storage.tsdb.path=/data/
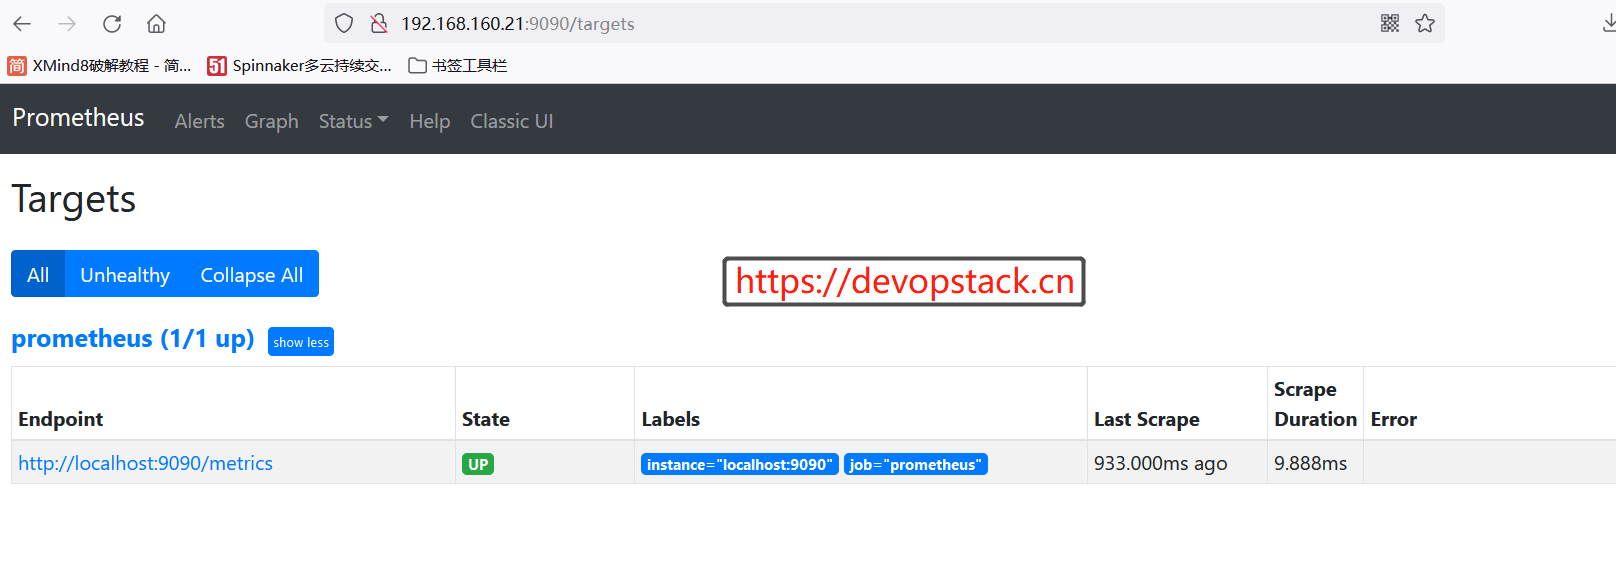
访问查看web,我们已成功启动prometheus
1.2 通过docker方式安装
https://prometheus.io/docs/prometheus/latest/installation/
2 prometheus配置文件解析
2.1 prometheus默认配置文件
global:
  # 默认情况下抓取目标的频率.
  [ scrape_interval: <duration> | default = 1m ]

  # 抓取超时时间.
  [ scrape_timeout: <duration> | default = 10s ]

  # 评估规则的频率.
  [ evaluation_interval: <duration> | default = 1m ]

  # 与外部系统通信时添加到任何时间序列或警报的标签
  #(联合,远程存储,Alertma# nager).
  external_labels:
    [ <labelname>: <labelvalue> ... ]

# 规则文件指定了一个globs列表.
# 从所有匹配的文件中读取规则和警报.
rule_files:
  [ - <filepath_glob> ... ]

# 抓取配置列表.
scrape_configs:
  [ - <scrape_config> ... ]

# 警报指定与Alertmanager相关的设置.
alerting:
  alert_relabel_configs:
    [ - <relabel_config> ... ]
  alertmanagers:
    [ - <alertmanager_config> ... ]

# 与远程写入功能相关的设置.
remote_write:
  [ - <remote_write> ... ]

# 与远程读取功能相关的设置.
remote_read:
  [ - <remote_read> ... ]
2.2 使用scrape_configs定义采集目标
:定义收集规则。 在一般情况下,一个scrape配置指定一个job。 在高级配置中,这可能会改变。
# 默认分配给已抓取指标的job名称。
job_name: <job_name>

# 从job中抓取目标的频率.
[ scrape_interval: <duration> | default = <global_config.scrape_interval> ]

# 抓取此job时,每次抓取超时时间.
[ scrape_timeout: <duration> | default = <global_config.scrape_timeout> ]

# 从目标获取指标的HTTP资源路径.
[ metrics_path: <path> | default = /metrics ]

# honor_labels控制Prometheus如何处理已经存在于已抓取数据中的标签与Prometheus将附加服务器端的标签之间的冲突("job"和"instance"标签,手动配置的目标标签以及服务发现实现生成的标签)。
#
# 如果honor_labels设置为"true",则通过保留已抓取数据的标签值并忽略冲突的服务器端标签来解决标签冲突。
#
# 如果honor_labels设置为"false",则通过将已抓取数据中的冲突标签重命名为"exported_ <original-label>"(例如"exported_instance","exported_job")然后附加服务器端标签来解决标签冲突。 这对于联合等用例很有用,其中应保留目标中指定的所有标签。
#
# 请注意,任何全局配置的"external_labels"都不受此设置的影响。 在与外部系统通信时,它们始终仅在时间序列尚未具有给定标签时应用,否则将被忽略。
#
[ honor_labels: <boolean> | default = false ]

** 配置请求的协议及认证 **
# 配置用于请求的协议方案.
[ scheme: <scheme> | default = http ]
# 可选的HTTP URL参数.
params:
  [ <string>: [<string>, ...] ]
# 使用配置的用户名和密码在每个scrape请求上设置`Authorization`标头。 password和password_file是互斥的。
basic_auth:
  [ username: <string> ]
  [ password: <secret> ]
  [ password_file: <string> ]
# 使用配置的承载令牌在每个scrape请求上设置`Authorization`标头。 它`bearer_token_file`和是互斥的。
[ bearer_token: <secret> ]
# 使用配置的承载令牌在每个scrape请求上设置`Authorization`标头。 它`bearer_token`和是互斥的。
[ bearer_token_file: /path/to/bearer/token/file ]
# 配置scrape请求的TLS设置.
tls_config:
  [ <tls_config> ]
# 可选的代理URL.
[ proxy_url: <string> ]

** 服务自动发现相关 **
# Azure服务发现配置列表.
azure_sd_configs:
  [ - <azure_sd_config> ... ]
# Consul服务发现配置列表.
consul_sd_configs:
  [ - <consul_sd_config> ... ]
# DNS服务发现配置列表。
dns_sd_configs:
  [ - <dns_sd_config> ... ]
# EC2服务发现配置列表。
ec2_sd_configs:
  [ - <ec2_sd_config> ... ]
# OpenStack服务发现配置列表。
openstack_sd_configs:
  [ - <openstack_sd_config> ... ]
# 文件服务发现配置列表。
file_sd_configs:
  [ - <file_sd_config> ... ]
# GCE服务发现配置列表。
gce_sd_configs:
  [ - <gce_sd_config> ... ]
# Kubernetes服务发现配置列表。
kubernetes_sd_configs:
  [ - <kubernetes_sd_config> ... ]

# Marathon服务发现配置列表。
marathon_sd_configs:
  [ - <marathon_sd_config> ... ]

# AirBnB的神经服务发现配置列表。
nerve_sd_configs:
  [ - <nerve_sd_config> ... ]

# Zookeeper Serverset服务发现配置列表。
serverset_sd_configs:
  [ - <serverset_sd_config> ... ]

# Triton服务发现配置列表。
triton_sd_configs:
  [ - <triton_sd_config> ... ]

** 静态目标配置区 **
# 此job的标记静态配置目标列表。
static_configs:
  [ - <static_config> ... ]

** 数据采集之前重新标记标签 **
# 目标重新标记配置列表。
relabel_configs:
  [ - <relabel_config> ... ]

** 数据采集之后重新标记标签 **
# 度量标准重新配置列表。
metric_relabel_configs:
  [ - <relabel_config> ... ]

# 对每个将被接受的样本数量的每次抓取限制。
# 如果在度量重新标记后存在超过此数量的样本,则整个抓取将被视为失败。 0表示没有限制。
[ sample_limit: <int> | default = 0 ]
2.3 relabel_config
重新标记是一种强大的工具,可以在抓取目标之前动态重写目标的标签集。 每个抓取配置可以配置多个重新标记步骤。 它们按照它们在配置文件中的出现顺序应用于每个目标的标签集。 如果重新标记步骤仅需临时存储标签值(作为后续重新标记步骤的输入),请使用__tmp标签名称前缀。 保证Prometheus本身不会使用此前缀。
relabel之前,除了自定义的标签外,还有一些其他的标签:
job,这个标签的值是配置文件中job_name配置的值
__address__这个标签的值是要抓取的地址和端口<host>:<port>
instance这个标签,在relabel之前是没有的,如果relabel期间也没有设置instance标签,默认情况下instance标签的值就是__address__的内容
__scheme__:http或https
__metrics_path__: metrics的路径
__param_<name>: http请求参数,<name>就是参数名
** 源标签从现有标签中选择值。 它们的内容使用已配置的分隔符进行连接,并与已配置的正则表达式进行匹配,以进行替换,保留和删除操作。
[ source_labels: '[' <labelname> [, ...] ']' ]
**分隔符放置在连接的源标签值之间。
[ separator: <string> | default = ; ]
** 在替换操作中将结果值写入的标签。
** 替换操作是强制性的。 正则表达式捕获组可用。
[ target_label: <labelname> ]
**与提取的值匹配的正则表达式。
[ regex: <regex> | default = (.*) ]
**采用源标签值的散列的模数。
[ modulus: <uint64> ]
**如果正则表达式匹配,则执行正则表达式替换的替换值。 正则表达式捕获组可用。
[ replacement: <string> | default = $1 ]
** 基于正则表达式匹配执行的操作。
[ action: <relabel_action> | default = replace ]
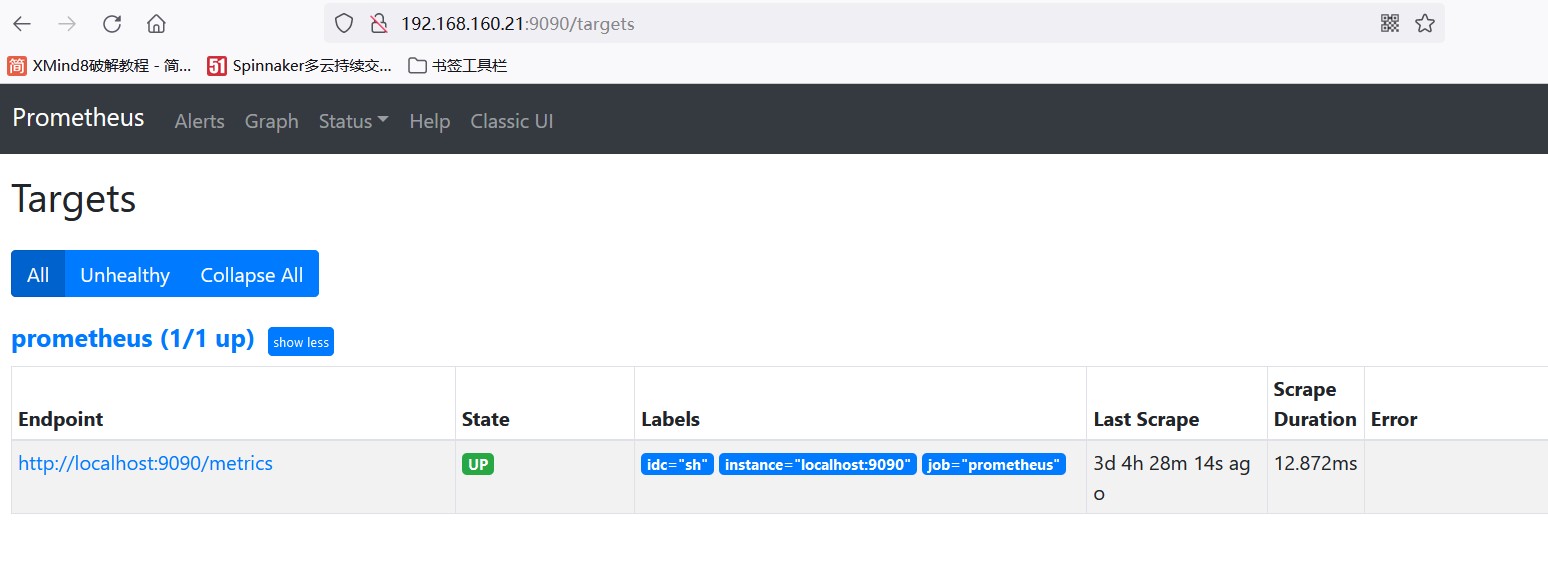
例子:给实例加个idc的标签
static_configs:
- targets: ['localhost:9090']
labels:
idc: sh
检查更新后的配置文件是否正常
[root@prometheus-server prometheus]# ./promtool check config prometheus.yml
Checking prometheus.yml
SUCCESS: 0 rule files found
热更新
[root@prometheus-server prometheus]# ps -ef|grep prometheus
root 1604 1 0 12:05 ? 00:00:13 /usr/local/prometheus/prometheus --config.file=/usr/local/prometheus/prometheus.yml --storage.tsdb.path=/data/
root 2284 2135 0 18:04 pts/0 00:00:00 grep --color=auto prometheus
[root@prometheus-server prometheus]# kill -hup 1604
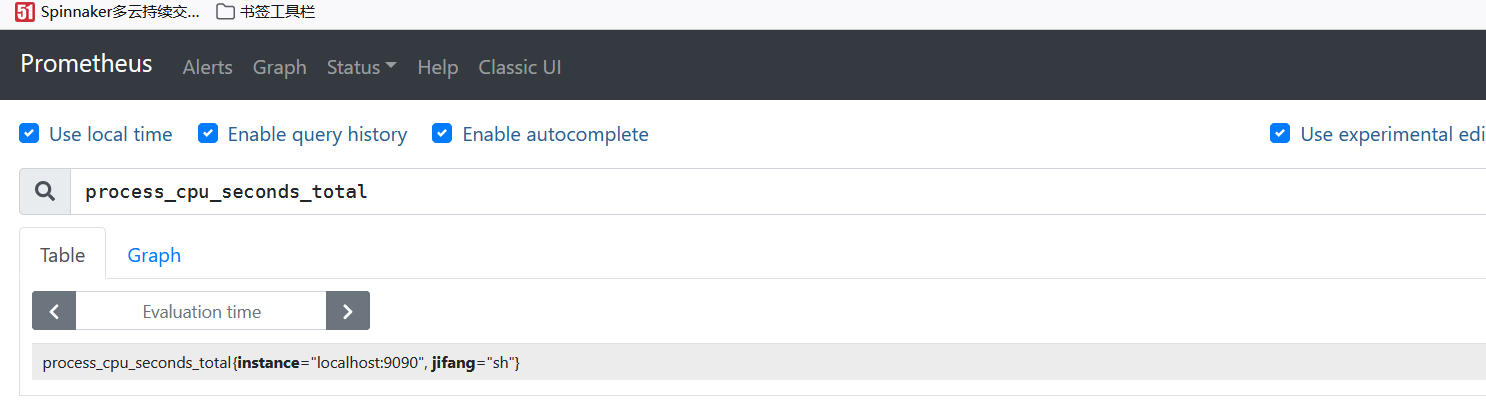
如图,我们已经打上标签了
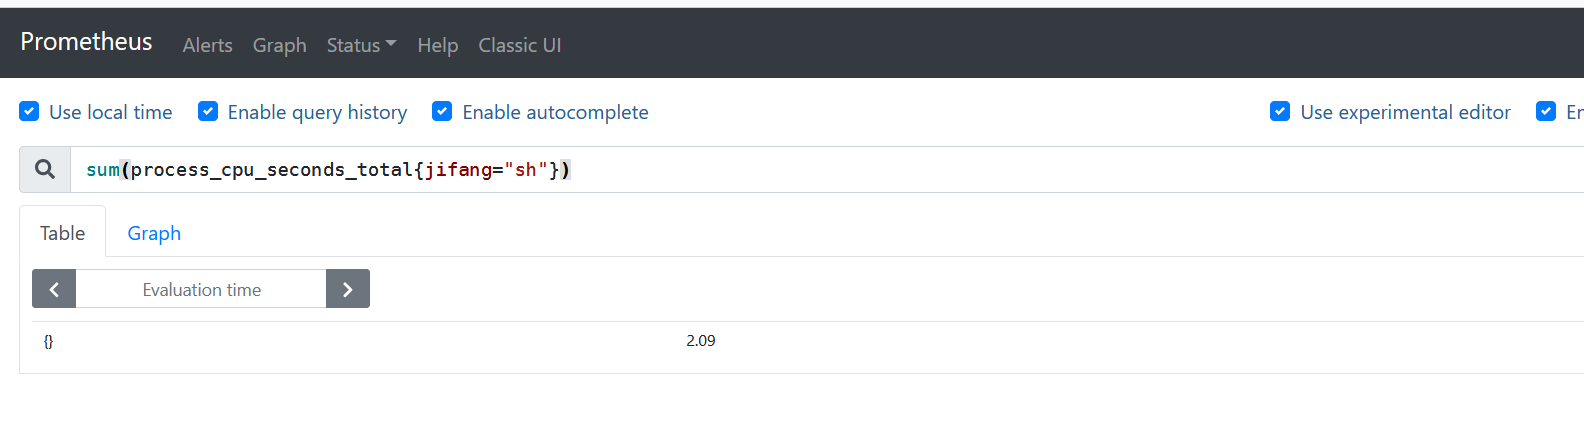
- 重命名已存在的标签
instance="localhost:9090"job="sh" 改为 instance="localhost:9090"idc="sh"

    static_configs:
    - targets: ['localhost:9090']
    relabel_configs:
    - action: replace
      source_labels: ['job']
      regex: (.*)
      replacement: $1
      target_label: jifang

[root@prometheus-server prometheus]# ./promtool check config prometheus.yml
Checking prometheus.yml
  SUCCESS: 0 rule files found

[root@prometheus-server prometheus]# kill -hup 873

如图 我们已经替换了标签,可以根据机房标签,计算整个机房用了多少cpu
2.3.1 action语法使用
<relabel_action>确定要采取的重新签名行动:
replace:将regex与连接的source_labels匹配。 然后,将target_label设置为replacement,将匹配组引用({1},{2},...)替换为其值。 如果正则表达式不匹配,则不进行替换。
keep:删除regex与连接的source_labels不匹配的目标。
drop:删除regex与连接的source_labels匹配的目标。
hashmod:将target_label设置为连接的source_labels的哈希模数。
labelmap:将regex与所有标签名称匹配。 然后将匹配标签的值复制到替换时给出的标签名称,替换为匹配组引用(${1},{2},...)替换为其值。
labeldrop:将regex与所有标签名称匹配。匹配的任何标签都将从标签集中删除。
labelkeep:将regex与所有标签名称匹配。任何不匹配的标签都将从标签集中删除。
必须小心使用labeldrop和labelkeep,以确保在删除标签后仍然对指标进行唯一标记。
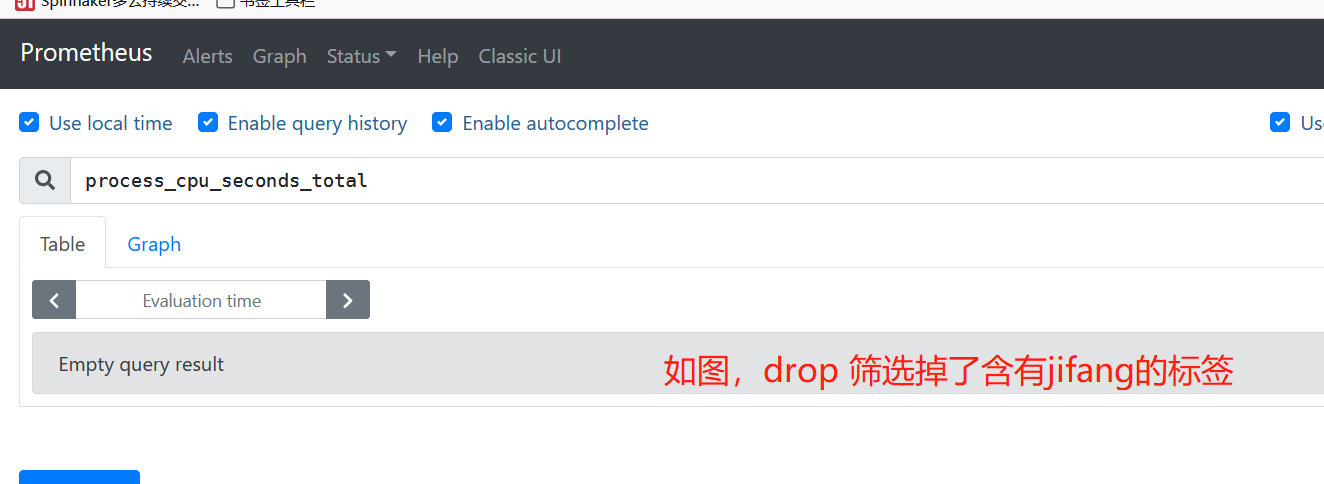
例子:使用drop筛选不采集含有指定标签的实例
- action: drop
source_labels: ['jifang']
[root@prometheus-server prometheus]# ./promtool check config prometheus.yml
Checking prometheus.yml
SUCCESS: 0 rule files found
[root@prometheus-server prometheus]# kill -hup 873
如图 drop 不采集含有jifang的标签了
例子:使用keep筛选采集含有指定标签的实例
    - action: keep
      source_labels: ['jifang']

[root@prometheus-server prometheus]# ./promtool check config prometheus.yml
Checking prometheus.yml
  SUCCESS: 0 rule files found

[root@prometheus-server prometheus]# kill -hup 873

如图

使用keep or drop 可以过滤想采集的目标或者过滤不想采集的目标
使用labelkeep labeldrop 删除匹配或者不匹配的标签

例子:删除匹配的标签
    - action: labeldrop
      regex: job

[root@prometheus-server prometheus]# ./promtool check config prometheus.yml
Checking prometheus.yml
  SUCCESS: 0 rule files found

[root@prometheus-server prometheus]# kill -hup 873

如下图 ,job这个标签已经从实例中删除了
labelmap标签名替换

    relabel_configs:
      - source_labels: [ '__metrics_path__' ]
        regex: __metrics_(.+)__   #这相当于将path截取出来作为新的标签名称
        action: labelmap

#或者下面的方式

    relabel_configs:
      - regex:  __metrics_(.+)__
        action: labelmap

#labelmap: 根据 regex 去匹配 Target 实例所有标签的名称(注意是名称),并且将捕获到的内容作为为新的标签名称,regex 匹配到标签的的值作为新标签的值.当然这个新的标签也会加到样本数据中。也就是你可以通过container_cpu_user_seconds_total{path="/metrics"}  进行查询
根据hashmod来选择采集哪些target

当relabel_config设置为hashmod时,Prometheus会根据modulus的值作为系数,计算source_labels值的hash值。

    relabel_configs:
      - source_labels: [ '__address__' ]
        modulus: 10
        target_label: tmp_hash
        action: hashmod

#根据当前Target实例__address__的值以10作为系数,这样每个Target实例都会包含一个新的标签tmp_hash,并且该值的范围在1~10之间.看下图.比如我又三个实例,还是把这个系数搞大一点吧,这样tmp_hash的值不容易重复。这时候比如我们想把tmp_hash=5这个的实例给drop掉(regex正则貌似对于IP那种正则匹配不好匹配上,通过这种可以屏蔽那个问题):

删除不需要的指标
- job_name: node_exporter
  static_configs:
  - targets: ['10.0.0.2:9100']
    labels:
      instance: "db01"
  # 删除node_netstat_Icmp6_InErrors和node_netstat_Icmp6_InMsgs指标
  metric_relabel_configs:
  - source_labels: [__name__]
    regex: "(node_netstat_Icmp6_InErrors|node_netstat_Icmp6_InMsgs)"
    action:  drop
删除不需要的标签
- job_name: kubernetes-cadvisor
  kubernetes_sd_configs:
  - role: node
  bearer_token_file: /var/run/secrets/kubernetes.io/serviceaccount/token
  tls_config:
    ca_file: /var/run/secrets/kubernetes.io/serviceaccount/ca.crt
    insecure_skip_verify: true
  metric_relabel_configs:
  - regex: kernelVersion
    action: labeldrop
2.4 服务发现
prometheus支持的服务发现来源列表
# Azure服务发现配置列表.
azure_sd_configs:

# Consul服务发现配置列表.
consul_sd_configs:

# DNS服务发现配置列表。
dns_sd_configs:

# EC2服务发现配置列表。
ec2_sd_configs:

# OpenStack服务发现配置列表。
openstack_sd_configs:

# 文件服务发现配置列表。
file_sd_configs:

# GCE服务发现配置列表。
gce_sd_configs:

# Kubernetes服务发现配置列表。
kubernetes_sd_configs:

# Marathon服务发现配置列表。
marathon_sd_configs:

# AirBnB的神经服务发现配置列表。
nerve_sd_configs:

# Zookeeper Serverset服务发现配置列表。
serverset_sd_configs:

# Triton服务发现配置列表。
triton_sd_configs:
2.4.1 file_sd_configs
文件服务发现配置列表。基于文件的自动发现,prometheus会定期读取文件中的配置并重新加载,文件可以是yml、yaml和json格式的。
file_sd_configs:
[ - <file_sd_config> ... ]
例子:
- job_name: 'file_sd'
file_sd_configs:
- files: ['/usr/local/prometheus/sd_config/*.yaml']
refresh_interval: 5s
- files:
- foo/*.slow.json
- foo/*.slow.yml
注释:
refresh_interval: 5s # 重新读取文件的间隔
[root@prometheus-server prometheus]# ./promtool check config prometheus.yml
Checking prometheus.yml
SUCCESS: 0 rule files found
[root@prometheus-server prometheus]# kill -hup 873
[root@prometheus-server prometheus]# cat sd_config/file.yaml
targets:
- 192.168.160.22:9100
labels:
project: test
env: prod
service: blog
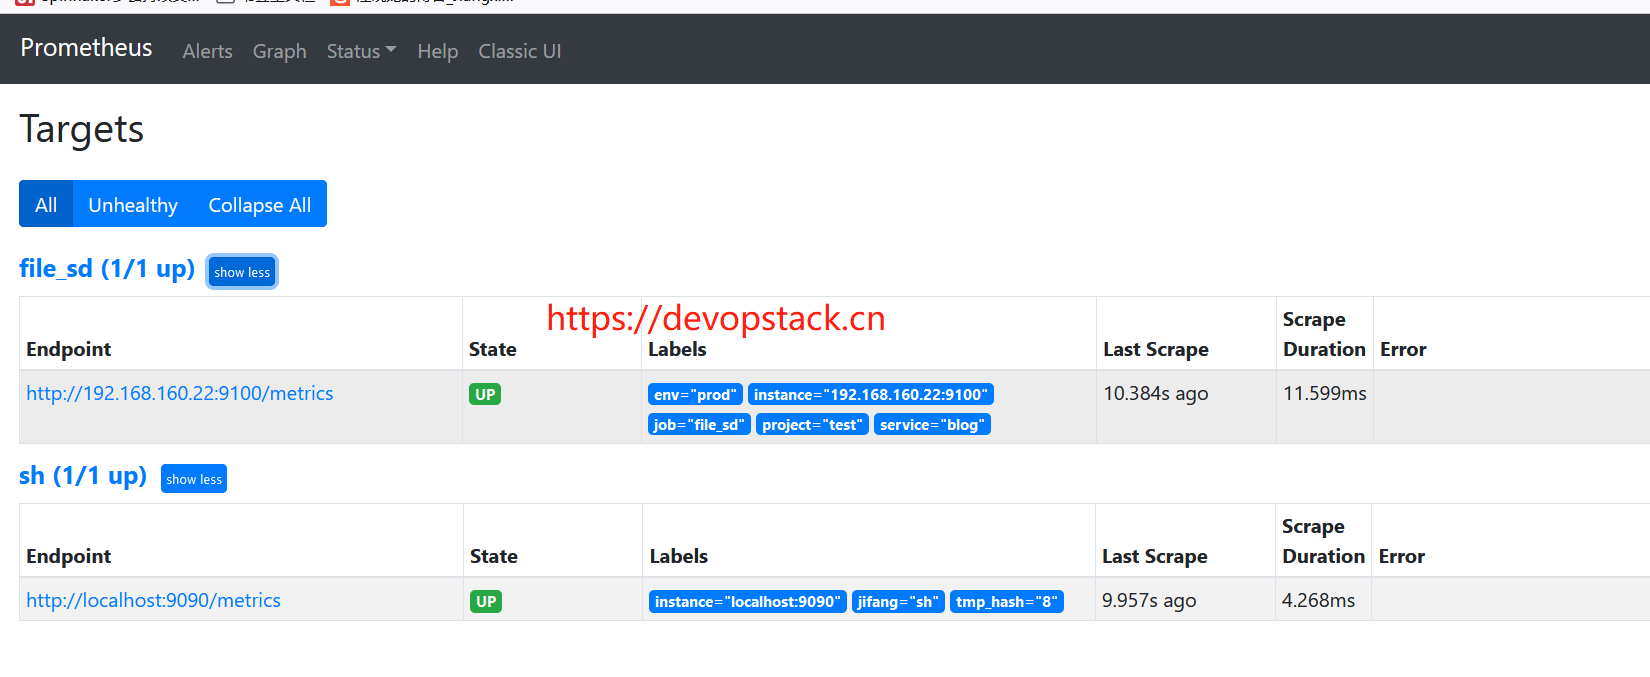
如下图,已自动发现
2.4.2 基于consul自动发现配置
- job_name: consul_sd
  consul_sd_configs:
  - server: 'localhost:1234'
    token: mysecret
    services: ['nginx', 'cache', 'mysql']
    tags: ["canary", "v1"]
    node_meta:
      rack: "123"
    allow_stale: true
    scheme: https
    tls_config:
      ca_file: valid_ca_file
      cert_file: valid_cert_file
      key_file:  valid_key_file
      insecure_skip_verify: false

  relabel_configs:
  - source_labels: [__meta_sd_consul_tags]
    separator:     ','
    regex:         label:([^=]+)=([^,]+)
    target_label:  {1}
    replacement:{2}
2.4.3 kubernetes_sd_configs
- job_name: kubernetes-cadvisor
  kubernetes_sd_configs:
  - role: node
  bearer_token_file: /var/run/secrets/kubernetes.io/serviceaccount/token
  tls_config:
    ca_file: /var/run/secrets/kubernetes.io/serviceaccount/ca.crt
    insecure_skip_verify: true
2.4.4 dns_sd_config
基于DNS的服务发现配置允许指定一组DNS域名,这些域名会定期查询以发现目标列表。 要联系的DNS服务器从/etc/resolv.conf中读取。 此服务发现方法仅支持基本的DNS A,AAAA和SRV记录查询,但不支持RFC6763中指定的高级DNS-SD方法。 在重新标记阶段,元标签__meta_dns_name在每个目标上可用,并设置为生成已发现目标的记录名称。
# 要查询的DNS域名列表。
names:
  [ - <domain_name> ]

# 要执行的DNS查询的类型。
[ type: <query_type> | default = 'SRV' ]

# 查询类型不是SRV时使用的端口号。
[ port: <number>]

# 提供名称后刷新的时间。
[ refresh_interval: <duration> | default = 30s ]

其中<domain_name>是有效的DNS域名。 其中<query_type>是SRV,A或AAAA。
2.4.5 ec2_sd_configs
scrape_configs:
  # The job name is added as a label `job=<job_name>` to any timeseries scraped from this config.
  - job_name: 'node'
    ec2_sd_configs:
      - region: cn-north-1
        port: 9100
    relabel_configs:
      - source_labels: [__meta_ec2_tag_Name]
        target_label: instance
3 prometheus.yml语法使用示例
# 抓取部分的配置
scrape_configs:
# job_name的值默认会做为job标签的值,job_name可以配置多个
- job_name: prometheus

  # 每个抓取请求上添加"Authorization"请求头,下面两个二选一
  bearer_token: xxxxxxxxxxxxxxxx
  bearer_token_file: /var/run/secrets/kubernetes.io/serviceaccount/token

  # 使用http还是https
  scheme: http

  # metrics路径
  metrics_path: metrics

  # 防止prometheus附加的标签、手动配置的标签以及服务发现生成的标签,和抓取数据中的标签冲突.
  # 默认是false,将抓取的数据中的冲突标签重命名为"exported_<original-label>".如果设置为true,则保留抓取数据中的标签
  honor_labels: true

  # 当Prometheus联合(联邦)另一个监控系统时,可能是该监控系统暴露了时间戳。对于带有时间戳的联合(联邦),如果时间戳消失,则Prometheus不会将指标数据标记为"stale"状态,相反它将出现在query.loopback值之前https://github.com/prometheus/prometheus/issues/5302
  # 默认true,则将使用target公开的指标数据的时间戳.如果设置为"false",则target的指标数据的时间戳将被忽略。
  honor_timestamps: true

  # 抓取数据的间隔(不写继承global)
  scrape_interval: 30s

  # 抓取数据的超时时间(不写继承global)
  scrape_timeout: 10s

  # 存储的数据标签个数限制,如果超过限制,该数据将被忽略,不入存储;默认值为0,表示没有限制
  sample_limit: 0

  # 文件自动发现配置,target的配置从下面指定的文件中读取
  file_sd_configs:
    - files:
      - foo/*.slow.json
      - foo/*.slow.yml
      - single/file.yml
      refresh_interval: 10m
    - files:
      - bar/*.yaml

  # target静态配置,从下面指定的目标中抓取数据
  static_configs:
  - targets: ['localhost:9090', 'localhost:9191']
    # 添加额外的标签
    labels:
      my:   label
      your: label

  # 重新标签
  relabel_configs:
  # 整段含义是使用"(.*)some-[regex]"匹配源标签中的内容,并将job这个标签的值=foo-{1},1就是匹配到的内容
  - source_labels: [job, __meta_dns_name]
    regex:         (.*)some-[regex]
    target_label:  job
    replacement:   foo-${1}

  # 直接将abc标签的值给cde标签
  - source_labels: [abc]  # 源标签
    target_label: cde     # 目标标签

  # 将static做为abc标签的值,即abc=static
  - replacement: static
    target_label: abc
  # 同上
  - regex:
    replacement: static
    target_label: abc
https://soulchild.cn/1965.html
https://www.jianshu.com/p/fb5c82de935d
https://www.cuiliangblog.cn/blog/section-169/
http://www.51niux.com/?cate=50
参考:https://prometheus.io/docs/prometheus/latest/configuration/configuration/
- 我的微信
- 这是我的微信扫一扫
-

- 我的微信公众号
- 我的微信公众号扫一扫
-